. 2020 Jun 10;1(1):96–111. doi: 10.1158/0008-5472.BCD-19-0041

Figure 4.

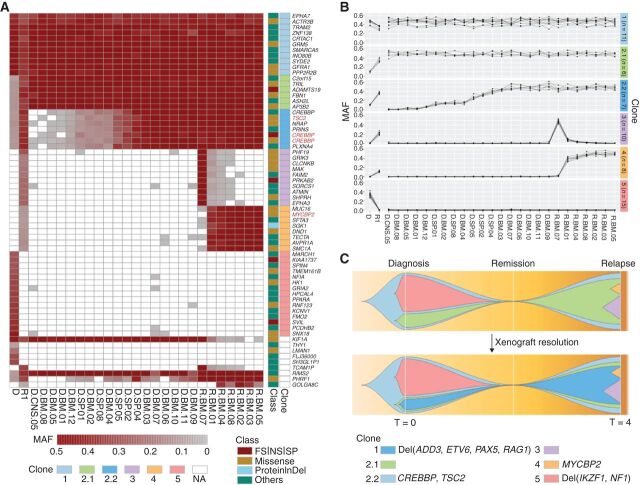
Figure 4. Integration of mutational landscape and xenografts resolves clonal structure in ALL. A, Somatic mutation spectrum of diagnosis (D), first relapse (R1), and xenografted leukemia samples. Leukemic cells from D (D.*.#) and R1 (R.*.#) from patient SJBALL036 were xenografted in mice and collected from bone marrow (*.BM.#), central nervous system (*.CNS.#), and spleen (*.SP.#). Cancer genes with nonsilent mutations are highlighted in red. FS, frameshift; NS, nonsense; SP, canonical splice site; proteinInDel, protein insertion/deletion. B, Delineation of clonal model from xenografted samples. MAF of SNV/indels were analyzed by sciClone (14) to infer clonal clusters. On the basis of the MAF in D and R1, clone 2.1 and 2.2 were indistinguishable. Xenograft data shows that clone 2.1 rises as a major clone (MAF = 0.5) in relapse alone or together with clone 2.2, indicating that 2.1 is the parental clone of 2.2. In addition, xenograft data showed variability in MAFs between clones 3 and 4, indicating that clones 3 and 4 were two distinct subclones. The clones are color-coded in the schema as in A. The number of somatic mutations in each clone is shown in parentheses. C, Fishplot of the leukemia evolution model. The top plot shows the original evolution model based on D and R1, and the bottom plot is the refined evolution model after incorporating the information from xenografted samples. The time (T) at diagnosis is defined as 0 and the first relapse was observed 4 years later. Nonsilent mutations and focal deletions (Del) affecting cancer genes are highlighted for each clone.

Integration of mutational landscape and xenografts resolves clonal structure in ALL. A, Somatic mutation spectrum of diagnosis (D), first relapse (R1), and xenografted leukemia samples. Leukemic cells from D (D.*.#) and R1 (R.*.#) from patient SJBALL036 were xenografted in mice and collected from bone marrow (*.BM.#), central nervous system (*.CNS.#), and spleen (*.SP.#). Cancer genes with nonsilent mutations are highlighted in red. FS, frameshift; NS, nonsense; SP, canonical splice site; proteinInDel, protein insertion/deletion. B, Delineation of clonal model from xenografted samples. MAF of SNV/indels were analyzed by sciClone (14) to infer clonal clusters. On the basis of the MAF in D and R1, clone 2.1 and 2.2 were indistinguishable. Xenograft data shows that clone 2.1 rises as a major clone (MAF = 0.5) in relapse alone or together with clone 2.2, indicating that 2.1 is the parental clone of 2.2. In addition, xenograft data showed variability in MAFs between clones 3 and 4, indicating that clones 3 and 4 were two distinct subclones. The clones are color-coded in the schema as in A. The number of somatic mutations in each clone is shown in parentheses. C, Fishplot of the leukemia evolution model. The top plot shows the original evolution model based on D and R1, and the bottom plot is the refined evolution model after incorporating the information from xenografted samples. The time (T) at diagnosis is defined as 0 and the first relapse was observed 4 years later. Nonsilent mutations and focal deletions (Del) affecting cancer genes are highlighted for each clone.