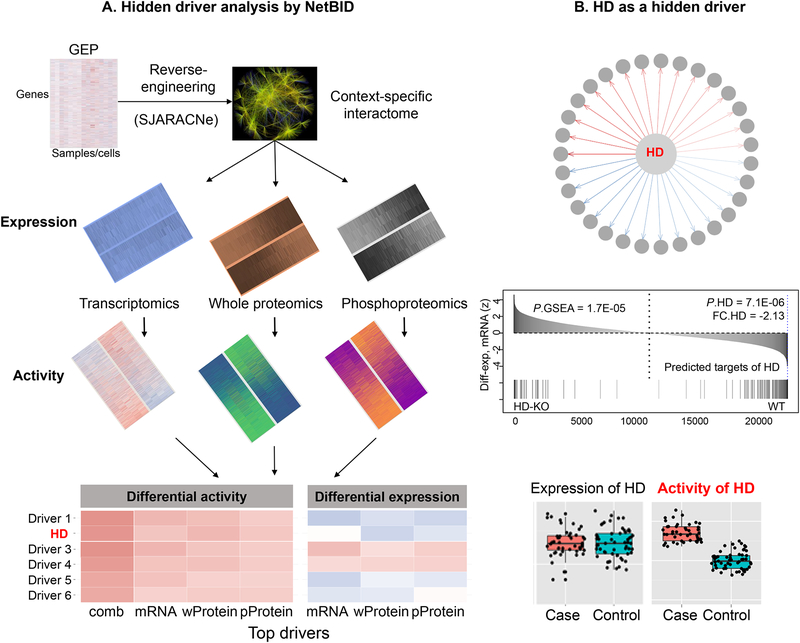
Figure 3.
Hidden driver analysis by NetBID. (A) The overview flowchart of NetBID analysis to identify hidden drivers of phenotype case vs. control. (B) An illustration of an example hidden driver (HD) that has no differential expression but has network enrichment and activity. Diff-exp, differential expression.

