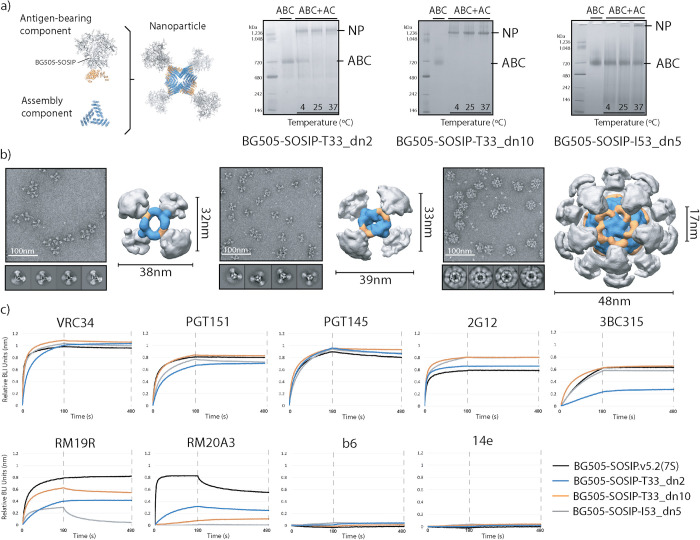
Fig 2. Nanoparticle assembly and characterization.
(a) Schematic representation of individual components and assembled nanoparticle (left). Nanoparticle assembly tests were performed at different temperatures and the assembly efficacy was assessed using Native PAGE. NP, nanoparticle; ABC, antigen-bearing component; AC, assembly component; (right). (b) Negative stain EM analysis of purified nanoparticles. Representative raw micrographs, 2D class averages and 3D reconstructions are shown for BG505-SOSIP-T33_dn2 (left), -T33_dn10 (middle) and -I53_dn5 (right) nanoparticles. 3D maps are segmented and color-coded (BG505 SOSIP, gray; antigen-bearing component, orange; assembly component, blue). Particle diameters and the average apex-apex distance between the two closest neighboring Env trimers are shown for each nanoparticle. These data are also described in Ueda, Antanasijevic et al., 2020 [38]. (c) BLI analysis of antigenicity of assembled nanoparticles compared to the BG505-SOSIP.v5.2(7S) trimer.

