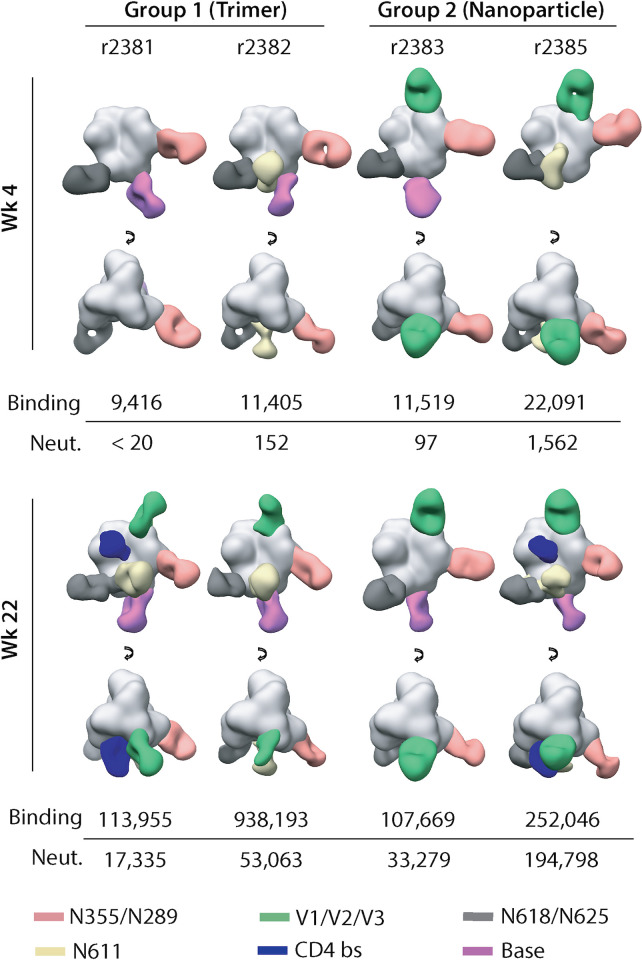
Fig 6. EMPEM analysis of antibody responses in immunized animals.
Composite figures generated from EMPEM analysis performed using sera collected from the two animals in each group that have the highest ConM NAb titers at week 22. Data are shown for the week 4 (post-prime) and week 22 (post-final boost) time points. For simplicity, only a single antibody is shown for each epitope cluster. Epitope definitions are summarized in the text and color coded as indicated at the foot of the figure. The anti-trimer binding antibody and neutralizing antibody titers for each serum sample are listed below the images.

