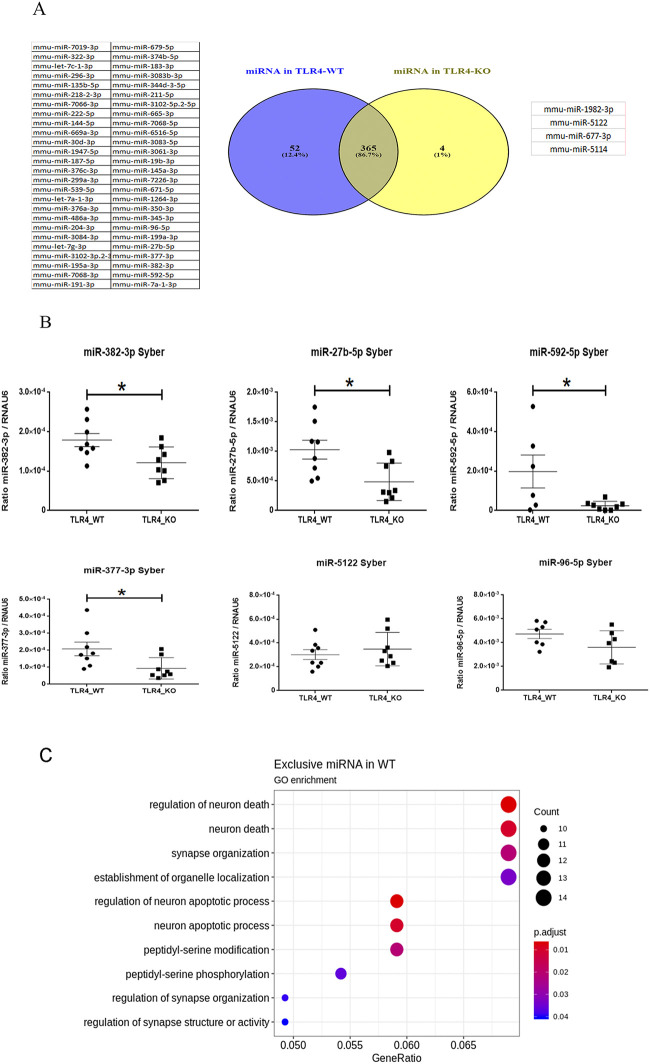
Fig 3.
Unique miRNA profile for each genotype: (A) The Venn’s diagram illustrated that 365 miRNAs were commonly expressed in both genotypes; 52 miRNAs were exclusively expressed for the WT and only four miRNAs belonged to the TLR4-KO mice. (B) RT-qPCR confirmed the differential expression pattern of some miRNAs, e.g. miR-382-3p, miR-27b-5p, miR-592-5p and miR-377-3p, which were down-regulated in the TLR4-KO mice, while miR-96-5p and miR-5122 were not deregulated as predicted by NGS. A statistical analysis was performed by the t-test with n = 6–8. Statistical significance with a p-value of *<0.05 and **<0.01. (C) Bioinformatics enrichment analysis of specific miRNAs in the WT mice.

