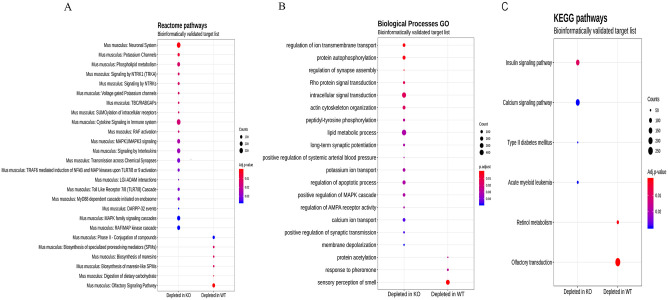
Fig 5. Enrichment analyses: Enrichment analyses results using miRNA to target the bioinformatics and experimental lists from the miR Database and TargetScan.
Analyses were performed with mdgsa [31] and clusterProfiler [32]. (A) Reactome pathways. (B) Biological Processes GO. (C) KEGG pathways. Abscissa axis indicates if the pathway or function is depleted in the WT or the knockout group. Ordinate axis displays the GO term or the pathway. The size of the round node is the number of genes in the function. Color is the adjusted p-value. Raw p-values were adjusted by FDR (Adjusted p-value < 0.05).

