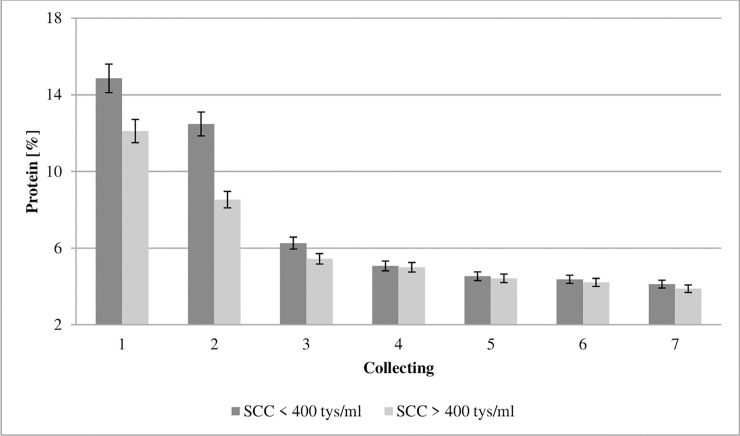
Fig 1. Effect of somatic cell counts on changes in immunoglobulin G concentration of colostrum.
SCC–somatic cell counts. Colostrum and milk samples were taken individually from each cow seven times during the experiment: from the first to second day after calving–twice per day, from the third to fifth day after calving–once per day. Data were presented as least squares means with standard error of mean. Statistical differences between SCC groups at P ≤0.01 and collections at P ≤0.01.

