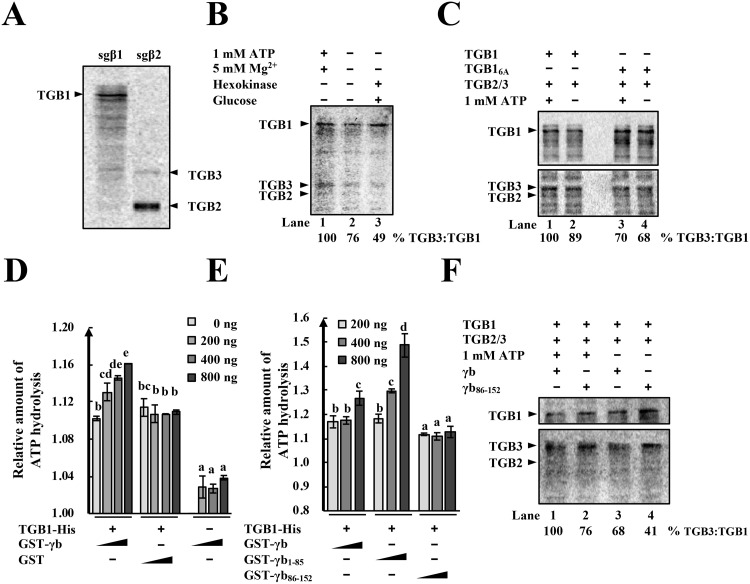
Fig 7. TGB1-TGB3 protein association increases after ATP hydrolysis and γb protein interactions.
(A) In vitro translations of TGB1 from subgenomic RNAβ1 (sgβ1), and TGB2 and TGB3 from sgβ2 RNA in wheat germ extracts. Arrowheads show positions of the target protein bands. Translation products were radiolabeled with 14C-Leucine and visualized by phosphor imaging. (B) ATP enhancement of TGB1-TGB3 protein binding. The 3xFlag-TGB1, TGB2 and TGB3 proteins were translated in vitro, mixed and divided into three treatment groups. Lane 1: TGB1-TGB3 binding in the presence of 1 mM ATP and 5 mM Mg2+; Lane 2: No treatment; Lane 3: Depletion of residual ATP by hexokinase and glucose addition to reaction mixes. Co-IP assays were evaluated by recovery from anti-FLAG M2 magnetic beads. Arrowheads show positions of the target protein bands. Band intensities of the TGB1 and TGB3 proteins were quantified by with ImageJ software. The relative ratios of TGB3 to TGB1 are shown below the images and the values of the first lane were set to 100%. (C) Effects of TGB1 ATPase disruption on TGB1-TGB3 associations. Flag-tagged TGB1 or the TGB16A was translated in vitro followed by Co-IP assays as described above. The band intensities of TGB1 and TGB3 were measured with ImageJ software and the relative ratios of TGB3 to TGB1 are shown below the images. The value of the lane 1 was set to 100%. Arrowheads indicate the positions of the target protein bands. (D) Dose dependent γb protein enhancement of TGB1 ATPase activities. Column 1–4: Increasing amounts of GST-γb protein (0 ng, 200 ng, 400 ng, 800 ng) on 1 μg TGB1-His ATPase activities. Columns 5–8: 1 μg TGB1-His with increasing amounts (0 ng, 200 ng, 400 ng, 800 ng) of GST proteins. Columns 9–12: Increasing amounts (0 ng, 200 ng, 400 ng, 800 ng) of GST-γb protein without TGB1-His. Column 9 is adjusted to 1.00. After incubation for 45 min, ATPase activities of the samples were measured at 620 nm with a microplate reader. Letters above each bar chart indicate statistically significant differences (P < 0.05) determined by Duncan’s multiple range test (n = 2). (E) Enhancement of TGB1 ATPase activities by TGB1-γb protein interactions. Columns 1–3: TGB1-His (1 μg) with increasing amounts of GST-γb proteins (200 ng, 400 ng, 800 ng). Column 4–6: TGB1-His (1 μg) with increasing amounts (200 ng, 400 ng, 800 ng) of GST-γb1-85 proteins. Column 7–9: 1 μg TGB1-His with increasing amounts (200 ng, 400 ng, 800 ng) of GST-γb86-152 proteins. Letters above each bar show statistically significant differences (P < 0.05) determined by Duncan’s multiple range tests (n = 3). (F) γb and γb86-152, enhancement of TGB1-TGB3 protein binding in the presence of ATP. In vitro translated GST-fused γb or γb86-152 proteins were mixed with in vitro synthetized TGB1, TGB2 and TGB3 in the presence or absence of ATP, incubated for 90 min, and Co-IP assays performed to evaluate TGB1 and TGB3 protein binding. Band intensities of the TGB1 and TGB3 proteins were quantified with ImageJ software and the relative ratios of TGB3 to TGB1 are shown below the images. Lane 1 is adjusted to 100% for comparisons of the different mixtures. Arrowheads indicate the positions of the target protein bands.

