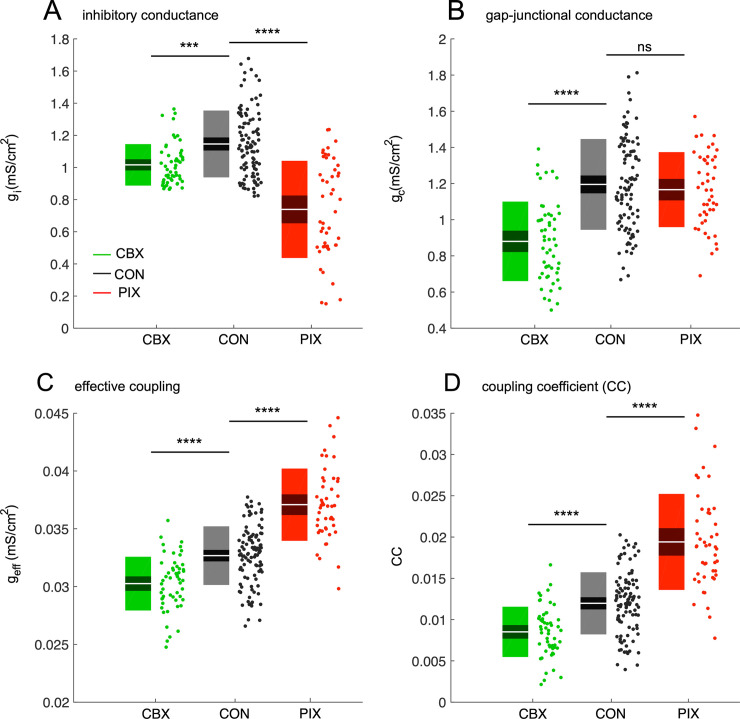
Fig 1. Estimation of conductance and coupling coefficients in the three experimental conditions.
A-B: Values of the GABAergic synaptic conductance gi (A) and electrical coupling conductance gc (B) estimates for the three experimental conditions: carbenoxolone (CBX, green box), control (CON, black box) and picrotoxin (PIX, red box). C: The effective coupling coefficient geff computed from Eq (1) for the three conditions. D: The coupling coefficient (CC) estimated via simulations for the three conditions. Each boxplot shows white line as the mean, dark region as 95% CIs and light region as 1 std. Asterisks represent significance levels: ns p > 0.05, ***p < 0.001, ****p < 0.0001.

