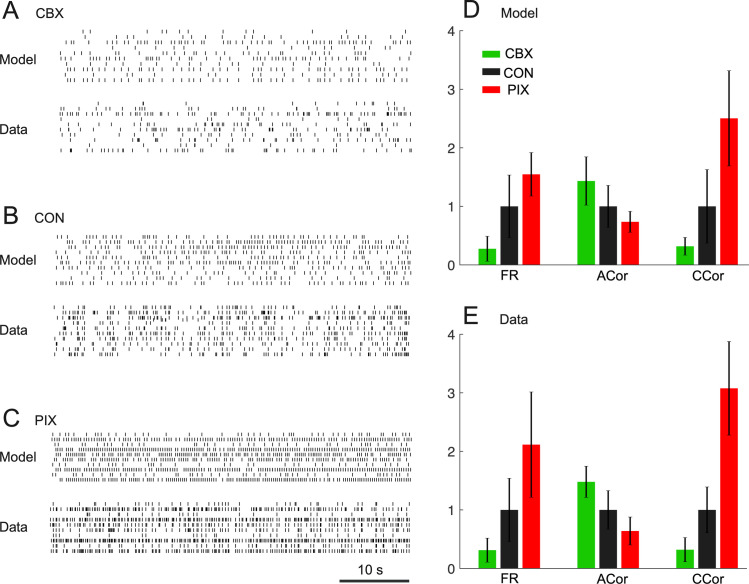
Fig 2. Similarity between IO firing for model and data.
A–C: Raster plots of ten representative IO neurons of the model and the experimental complex spike data of three animals in the three conditions. Each row of tick marks represents the activity of a single neuron. A. Carbenoxolone (animal #1, irregular spiking). B. Control (animal #7, oscillatory spiking) C. Picrotoxin (animal #9, highly synchronous spiking). D–E: Three major spatiotemporal features extracted from the spike trains–firing rates, auto-correlations and cross-correlations–in the three data conditions of the model (D) and the data (E). FR: firing rates. ACor: auto-correlation. CCor: cross-correlation. The ordinates of D–E are scaled so that the mean value of the CON is 1.

