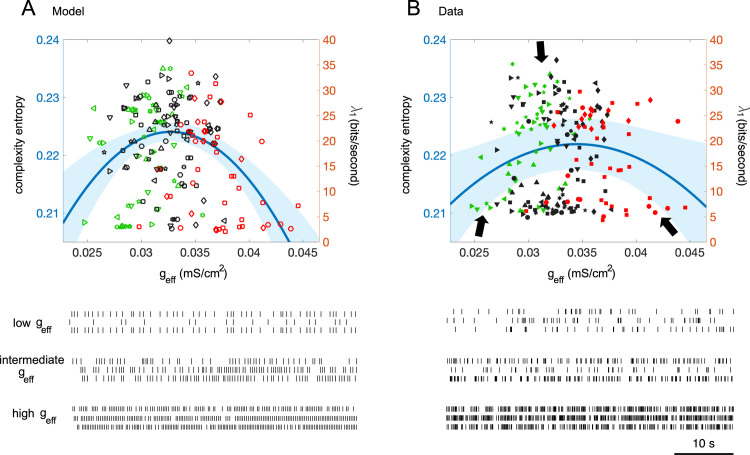
Fig 4. Inverted U-shaped relationship of complexity versus effective coupling, model and data.
A-B: Complexity entropy versus effective coupling. Upper panel: chaotic levels measured by the complexity entropy of the spike data as a function of effective coupling strength for the model (A) and real IO neurons (B) confirming that moderate couplings induce chaos. Each value in (A) (open symbols) is given by the model neuron that best fits to the actual IO neuron in terms of the PCA error. The right ordinates of A-B represent the first Lyapunov exponents approximated from the simulation data (S8B Fig). Each type of symbol in (B) represents the data of an individual animal. The cyan solid lines indicate the second-order of linear model (A) and mixed-effects model (B) and shaded regions are of 95% CIs. Lower panel: spike trains of the representative neurons (located at dark arrows in the upper panel of Fig 4B) which show periodic and synchronous firings for either low or high couplings but exhibits chaotic firings for intermediate couplings.

