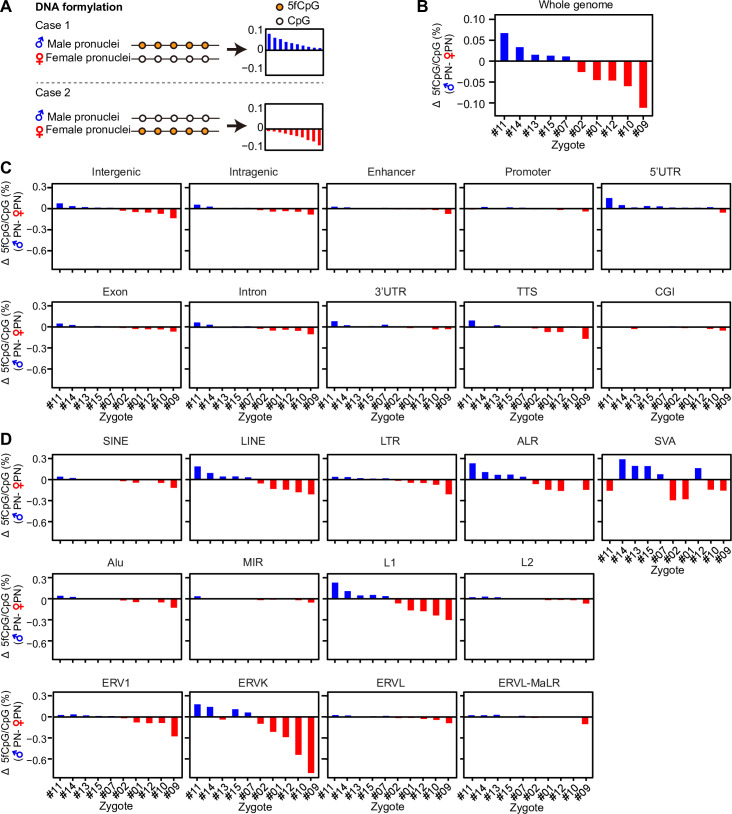
Fig 5. The asymmetric 5fCpG distribution in paired pronucleus.
(A) The illustration diagram showing the two cases of 5fCpG level in paired pronucleus. The bar plot is used to show the difference of 5fCpG level in male pronuclei minus that in corresponding female one. The bar is in blue if the male pronuclei has higher 5fCpG level than female one (difference > 0), otherwise it is in red. (B) The bar plot showing the difference of 5fCpG level between paired pronucleus in whole genome (n = 10). The difference is calculated by 5fCpG level in male pronuclei minus that in corresponding female one. The order of paired pronuclei is ranked by the value of difference from high to low. (C) The bar plot showing the difference of 5fCpG level between paired pronucleus in distinct genomic region (n = 10). The pronuclei are ranked by the order showed in Fig 5B. (D) The bar plot showing the difference of 5fCpG level between paired pronuclei in distinct repeat elements (n = 10). The pronuclei are ranked by the order showed in Fig 5B. (B–D) The numerical data are listed in S1 Data. ALR, alpha-satellite repeat; CGI, CpG island; CpG, cytosine phosphate guanine; ERV1, endogenous retrovirus-1; ERVK, endogenous retrovirus-K; ERVL, endogenous retrovirus-L; ERVL-MaLR, endogenous retrovirus-L, mammalian-apparent long-terminal repeat retrotransposon; LINE, long interspersed nuclear element; LTR, long terminal repeat; MIR, mammalian-wide interspersed repeat; SINE, short interspersed nuclear element; SVA, SINE/variable number of tandem repeats/Alu; TTS, transcriptional termination site; UTR, untranslated region; 5fCpG, 5-formylcytosine phosphate guanine.

