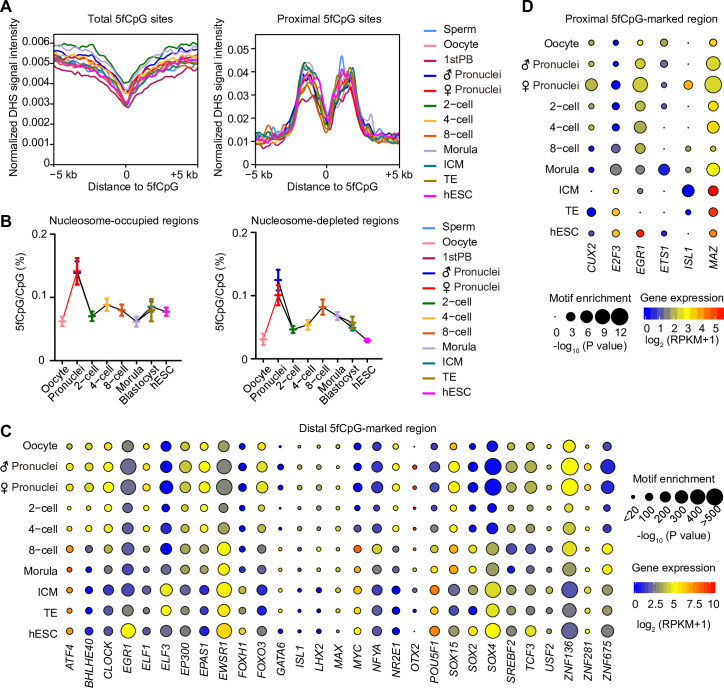
Fig 6. The regulatory network of 5fC-mark region.
(A) The normalized DHS signal of hESC at the center of all 5fCpG sites and its flanking regions (left panel) as well as at the center of proximal 5fCpG sites (TSS ± 2 kb) and its flanking regions (right panel) in each development stage are shown. The DHS signal of hESC is downloaded from GSE32970. (B) The line chart showing the 5fCpG level in NORs (left panel) and in NDRs (right panel). The 5fCpG level was calculated by the number of 5fCpG sites divided by the sum number of 5fCpG and unmodified CpG sites. scCOOL-seq of human preimplantation embryos is from GSE100272. The center is the mean of 5fCpG level, and error bars are SEM. (C) Motif analysis of 5fCpG-marked distal regions (2 kb away from TSS). Only motif with P ≤ 10−20 and RPKM ≥ 1 in at least one stage are shown in the diagram. The significance was calculated by the binomial test in HOMER by default of motif enrichment. The color of the circle from blue to red indicates the expression level in each stage from low to high. The scRNA-seq data of human early embryos and ESCs are from GSE36552. The size of the circle indicates the −log10(P value). (D) Motif analysis of 5fCpG-marked proximal regions (TSS ± 2 kb). Only motif with P ≤ 10−5 and RPKM ≥ 1 in at least one stage are shown in the diagram. The significance was calculated by the binomial test in HOMER by default of motif enrichment. The color of the circle from blue to red indicates the expression level in each stage from low to high. The scRNA-seq data of human early embryos, and ESCs are from GSE36552. The size of the circle indicates the −log10 P value. (A–D) The sample size in these panels are listed in Fig 1A. (B–D) The numerical data are listed in S1 Data. CpG, cytosine phosphate guanine; DHS, DNase I hypersensitive sites; ESC, embryonic stem cell; hESC, human embryonic stem cell; HOMER, hypergeometric optimization of motif enrichment; NDR, nucleosome-depleted region; NOR, nucleosome-occupied region; scCOOL-seq, chromatin overall omic-scale landscape sequencing; RPKM, reads per kilobase of transcript per million mapped reads; scRNA-seq, single-cell RNA sequencing; SEM, standard error of the mean; TSS, transcription start site; 5fC, 5-formylcytosine; 5fCpG, 5-formylcytosine phosphate guanine.

