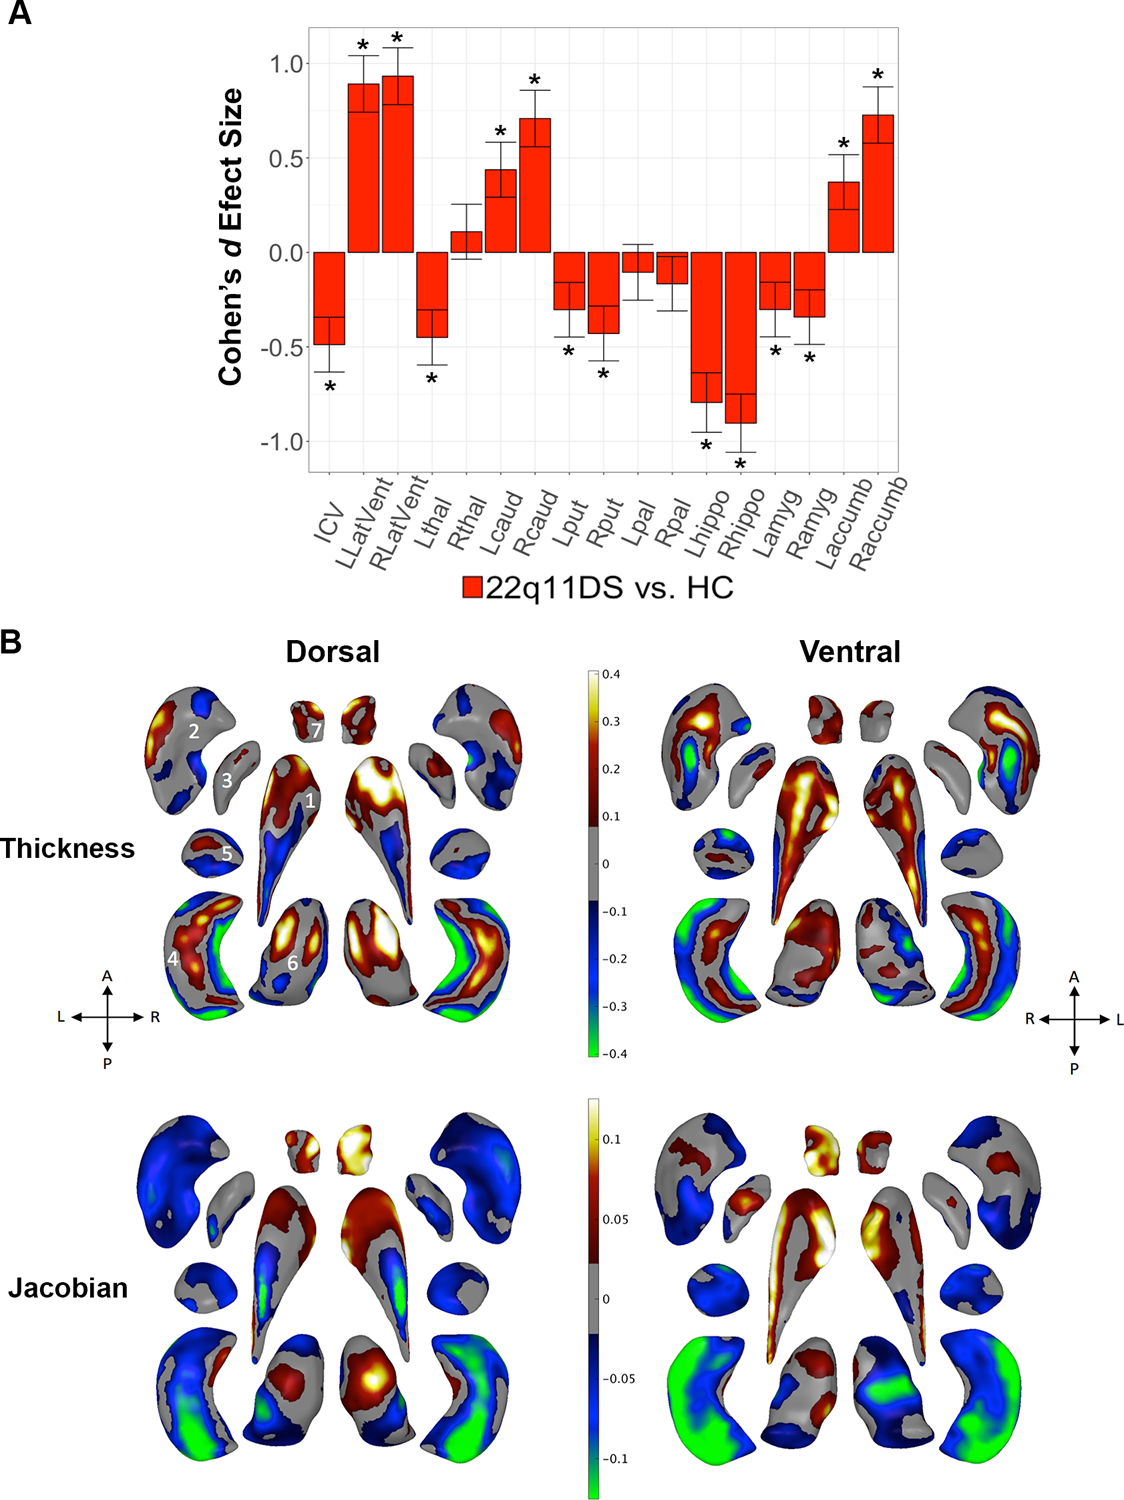
Figure 1:

22q11DS vs. HC: Gross volume and shape analysis. A. Cohen’s d effect size (with 95% confidence intervals) plotted for major pairwise gross volumetric comparisons. An asterisk (*) indicates significant group difference after correction for multiple comparisons for 22q11DS versus HC (FDR q<0.05). Positive effect sizes indicate 22q11DS>HC; negative effect sizes indicate HC>22q11DS. Models were adjusted for age, age2, sex, ICV, and scan site. Full statistical model outputs including standard error, coefficient estimates, p-values, and % difference may be found in Supplemental Table S14. Abbreviations: L/R, left/right; LatVent, lateral ventricle; thal, thalamus; caud, caudate; put, putamen; pal, pallidum; hippo, hippocampus; amyg, amygdala; accumb, accumbens; ICV, intracranial volume. B. Shape analysis with regression coefficients plotted in regions passing correction for multiple comparisons (FDR q<0.05). Blue/green colors indicate negative coefficients, or regions of lower thickness (i.e., local radial distance) or Jacobian (i.e., local surface area contraction) measures in 22q11DS versus HC. Red/yellow colors indicate positive coefficients, or regions of greater thickness or Jacobian values in 22q11DS versus HC. The top row includes thickness results; the bottom row includes Jacobian surface area results. Dorsal and ventral views of the structures are provided: A, anterior; P, posterior; L, left; R, right. 1. Caudate; 2. Putamen; 3. Globus Pallidus; 4. Hippocampus; 5. Amygdala; 6. Thalamus; 7. Nucleus Accumbens. Gray regions indicate areas of no significant difference after correction for multiple comparisons.
