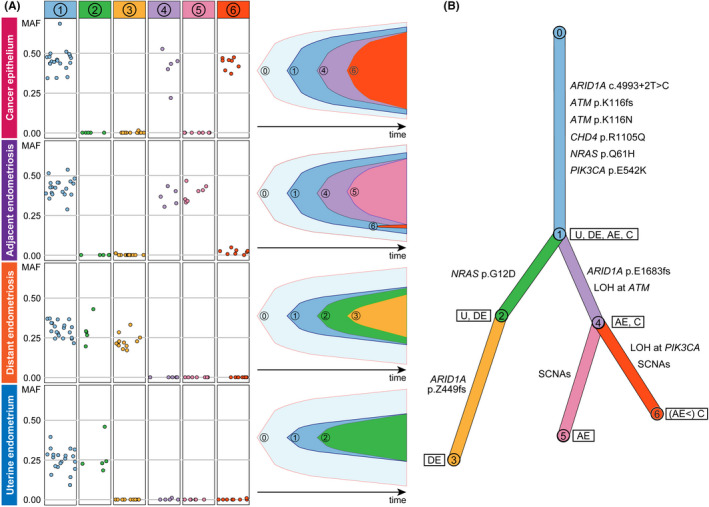
FIGURE 6.

Clonal relationships among the four epithelium samples. A, Somatic single nucleotide variants (SNV) and indels were classified into six clusters based on their mutant allele frequency (MAF) profiles with PyClone. The prevalence of the six clones in each of the epithelium samples was evaluated, and clonal ordering was then implemented with ClonEvol to create fish plots showing clonal evolutions within the samples. B, A branch‐based clonal evolution tree was generated with ClonEvol. Mutations in cancer‐associated genes except for PIK3CA and ATM were assigned to branches based on the result of mutation clustering by PyClone. Mutations in PIK3CA and ATM were excluded from the analysis of mutation clustering because they were located in SCNA. The PIK3CA and ATM mutations were manually assigned to the initial branch because they were shared at a clonal state among all epithelium samples. The lengths of the branches are associated with the number of somatic mutations
