
Figure 3.
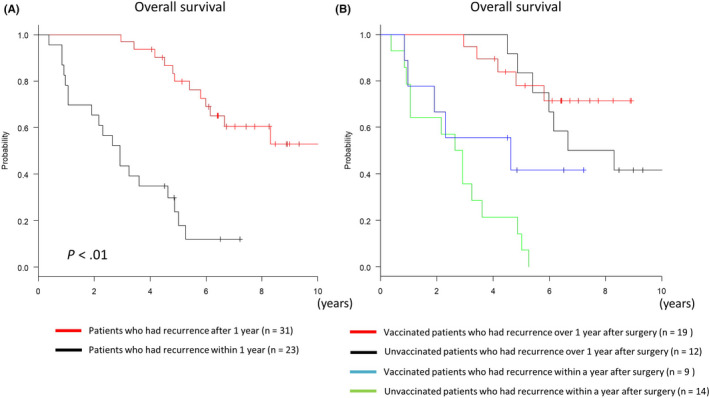
Kaplan‐Meier curves for overall survival (OS). A, Patients who had recurrence after 1 y (n = 31) had significantly better OS than patients who had a recurrence within 1 y (n = 23). B, OS improved in the vaccinated group regardless of whether recurrence took place within 1 y or later; some patients survived long term (beyond 5 y)