FIGURE 2.

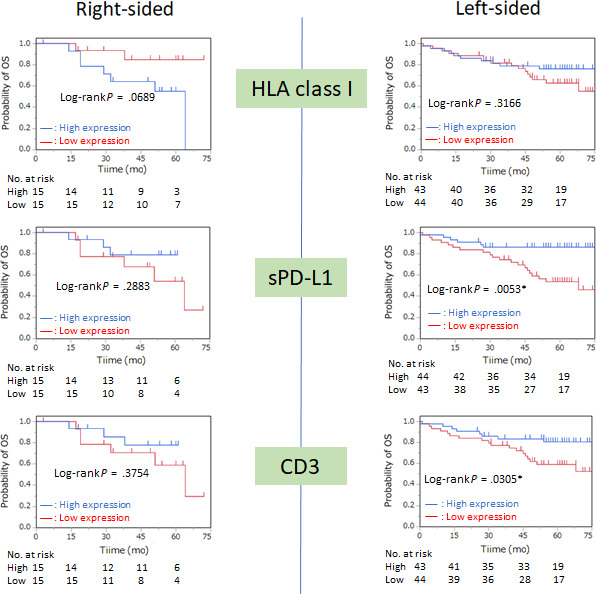
Kaplan‐Meier curves of overall survival (OS) according to location of colorectal tumor based on the expression of HLA class I, programmed cell death‐ligand 1 on stromal cells (sPD‐L1), and CD3. Median values were used as the cut‐off point

Kaplan‐Meier curves of overall survival (OS) according to location of colorectal tumor based on the expression of HLA class I, programmed cell death‐ligand 1 on stromal cells (sPD‐L1), and CD3. Median values were used as the cut‐off point