
FIGURE 3.
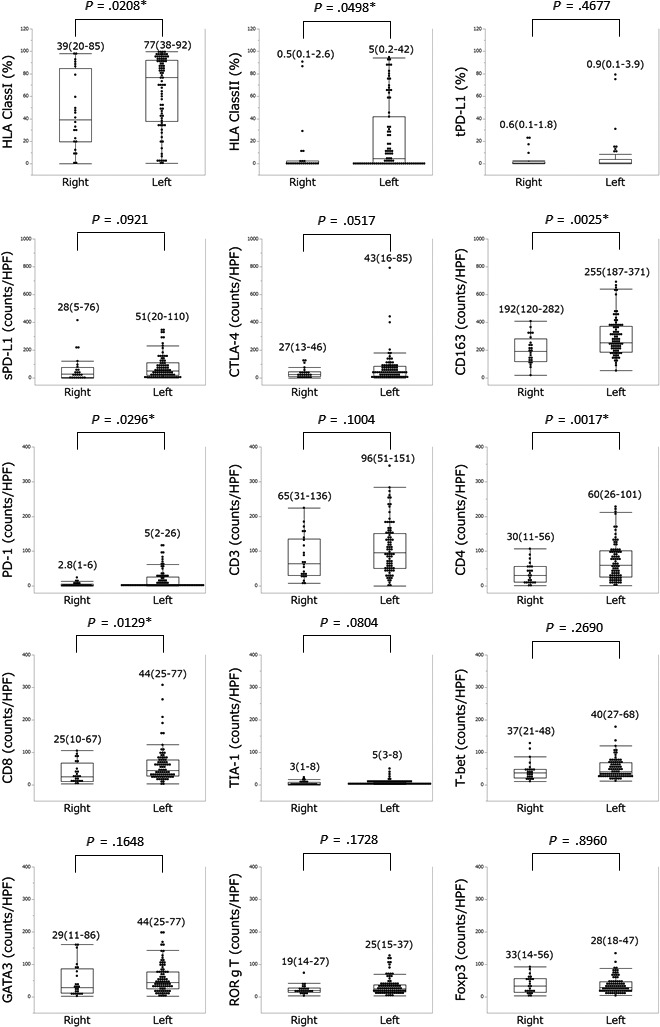
Molecular expression rate/number in right‐ and left‐sided colorectal tumors in DNA mismatch repair proficiency. Numbers above each plot represent the median and interquartile range. HPF, high power field; PD‐1, programmed cell death‐1; sPD‐L1, programmed cell death‐ligand 1 in stromal cells; tPD‐L1, programmed cell death‐ligand 1 in tumor cells