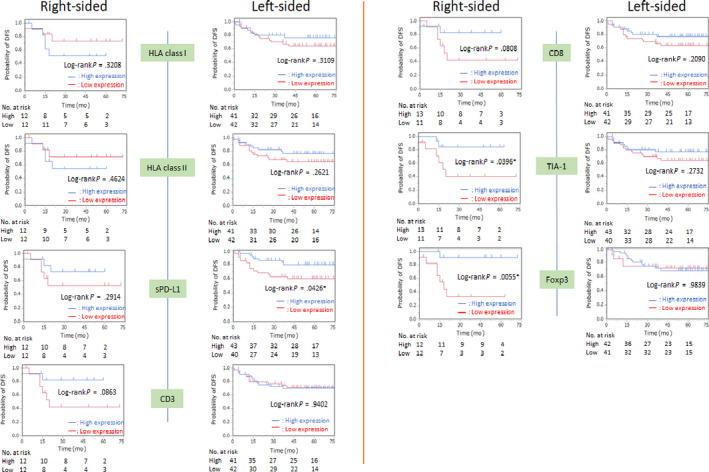
FIGURE 4.

Kaplan‐Meier curves of disease‐free survival (DFS) according to location of colorectal tumor excluding DNA mismatch repair deficiency based on the expression of HLA class I, HLA class II, programmed cell death‐ligand 1 on stromal cells (sPD‐L1), CD3, CD8, TIA‐1, and Foxp3. Median values were used as the cut‐off point
