
Figure 2.
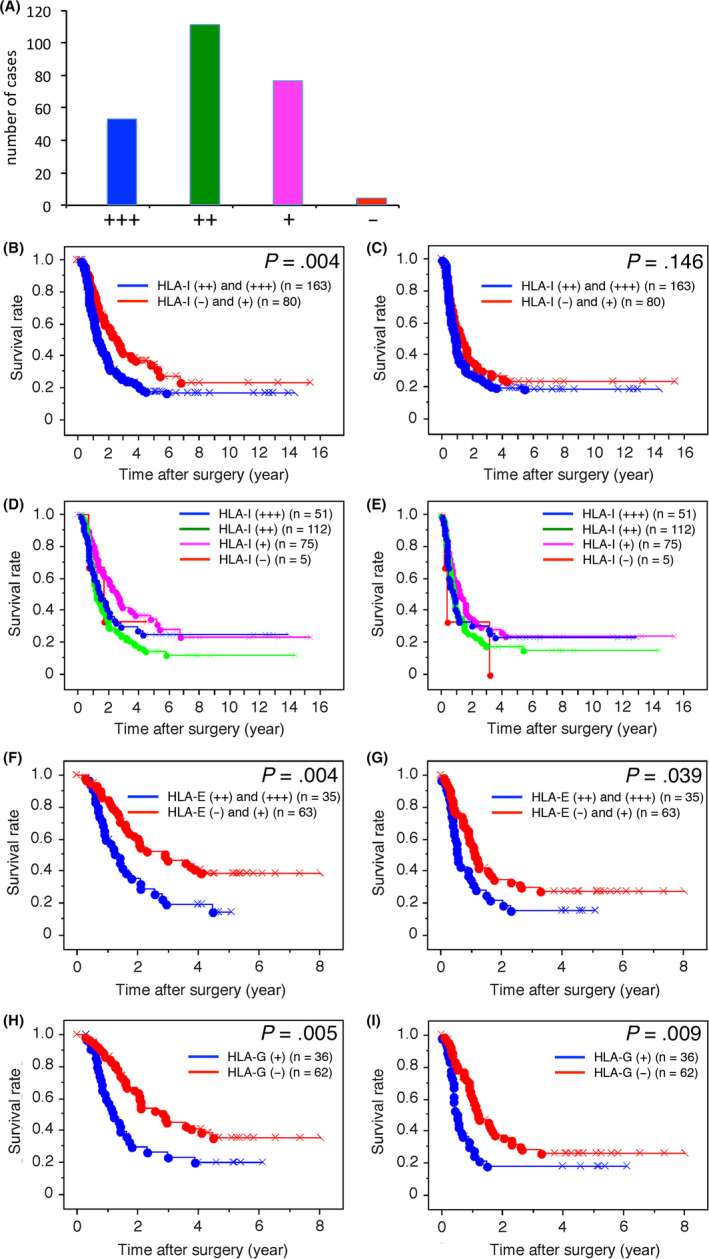
A, Bar graph showing the number of pancreatic ductal adenocarcinoma (PDAC) cases in each of the four human leukocyte antigen class I antigens (HLA‐I) expression level categories. B‐I, Kaplan‐Meier survival curves for overall survival (OS) in patients with PDAC according to HLA‐I (B, D), HLA‐E (F) HLA‐G (H) expression, and for disease‐free survival (DFS) in patients with PDAC according to HLA‐I (C, E), HLA‐E (G) and HLA‐G (I) expression