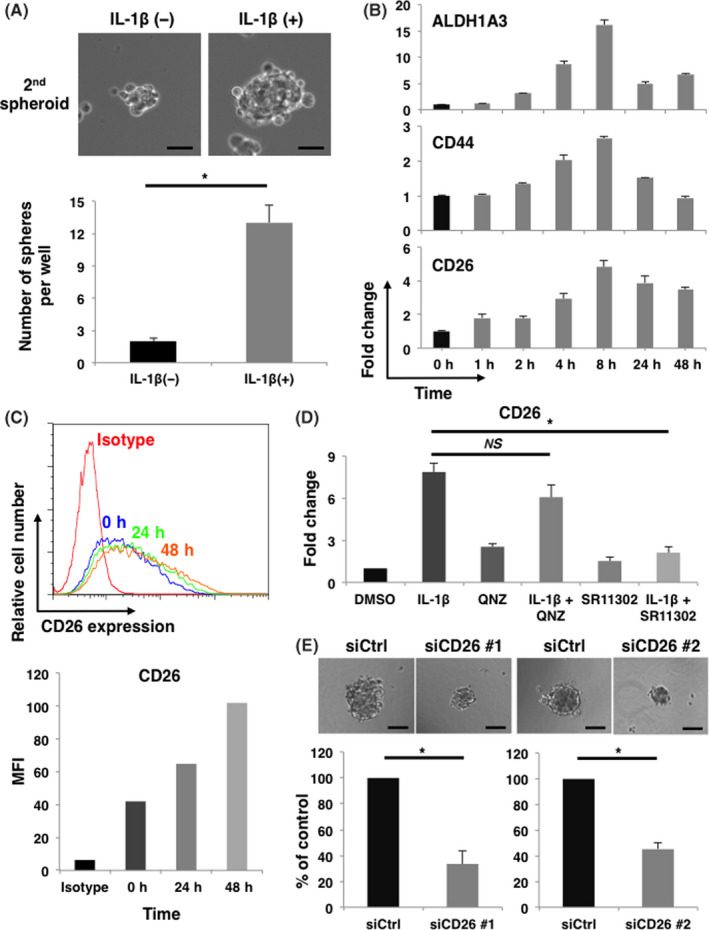
FIGURE 2.

IL‐1β promotes sphere formation through upregulation of CD26 in IL‐1R‐overexpressing H2452 cells. A, H2452 cells were cultured with or without 10 ng/mL of rhIL‐1β on poly‐HEMA plate to evaluate sphere forming ability. Representative phase contrast images and quantification of the number of spheres are shown in upper and lower panel, respectively. Results represent the mean ± SEM of 3 independent experiments performed in triplicates. Scale bars, 50 μm, *P < .01. B, Representative data of expression of ALDH1A3, CD44, and CD26 transcripts induced by rhIL‐1β at the indicated time points are shown. Experiments were repeated twice in triplicates with similar results. Error bars, SEM. C, Cell surface CD26 expression induced by 10 ng/mL of rhIL‐1β at the indicated time points was analyzed by flow cytometry. Representative histogram and mean fluorescence intensity (MFI) are shown in upper and lower panel, respectively. Experiments were repeated twice with similar results. Error bars, SEM. D, Expression of CD26 transcripts in H2452 cells stimulated by 10 ng/mL of rhIL‐1β for 8 h in the presence of QNZ or SR11302 was measured by qRT‐PCR. Results represent mean ± SEM of 3 independent experiments performed in triplicates. *P < .01. E, Sphere forming ability of H2452 cells either transfected with control or 2 different CD26 targeting siRNAs (siCD26 #1 and siCD26 #2) was examined. Representative phase contrast images and quantification of the relative number of spheres are shown in left and right panel, respectively. Results represent mean ± SEM of 3 independent experiments performed in triplicates. Scale bars, 100 μm, *P < .01
