
FIGURE 3.
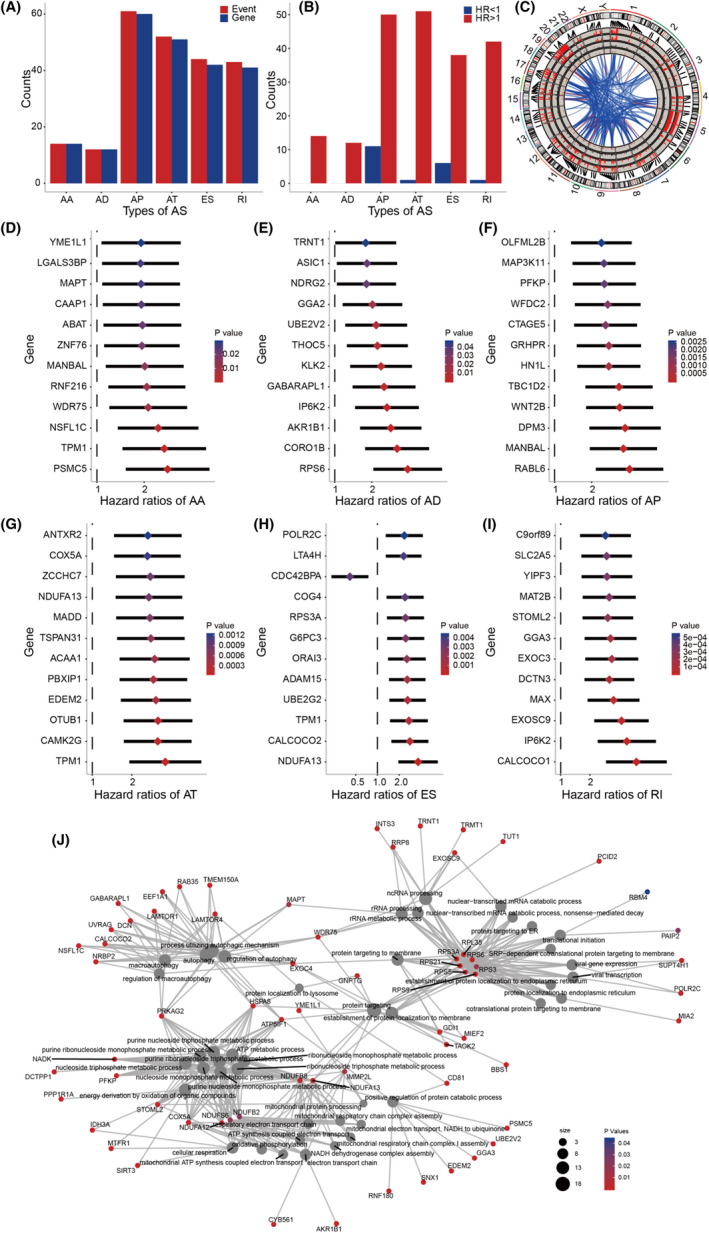
A, Number of prognosis‐related alternative splicing (AS) events and involved genes. B, The distribution of different types of AS between beneficial to survival (HR < 1) and unfavorable to survival (HR > 1). C, Detail of AS events and related genes was shown in a Circos plot. The ribbons represent the potential interaction between the related gene of differentially expressed AS, and the thickness of the ribbons indicating the extent of the interaction strength. D‐I, The detail of survival‐related AS events and types of AS in Forest map (top 12). J, Gene network construction and functional enrichment analysis