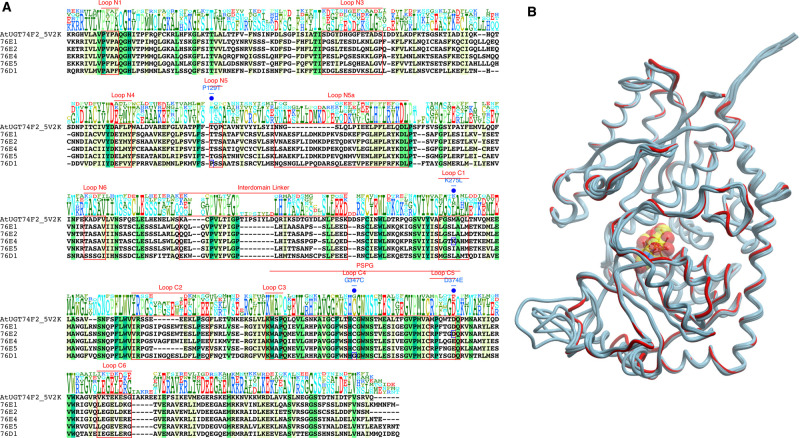
Figure 2. Sequence and structure comparison of group H AtUGTs.
(A) Multiple sequence alignment of AtUGT74F2 with group H AtUGTs reported in this study. Different regions are annotated above the sequences. The positions of mutation are marked in blue (B) Superimposition of 3D structures showing similarity between the models (cyan) and template AtUGT74F2 (red). UDP-sugar is illustrated in CPK.

