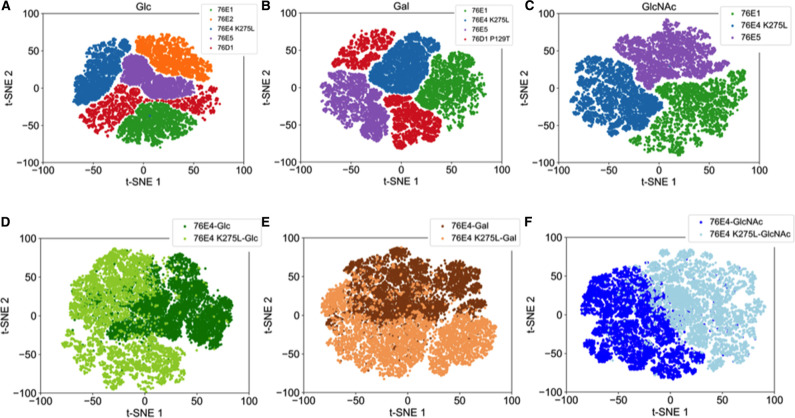
Figure 6. Structural profiles of UGT variants based on substrate specificity.
The 2D t-SNE plots illustrate the latent spaces of the enzymes exhibiting positive activity for (A) UDP-Glc, (B) UDP-Gal, and (C) UDP-GlcNAc. The 2D t-SNE plots illustrate the latent spaces of the wildtype UGT 76E4 and the mutant 76E4 K275L against (D) UDP-Glc, (E) UDP-Gal, and (F) UDP-GlcNAc.

