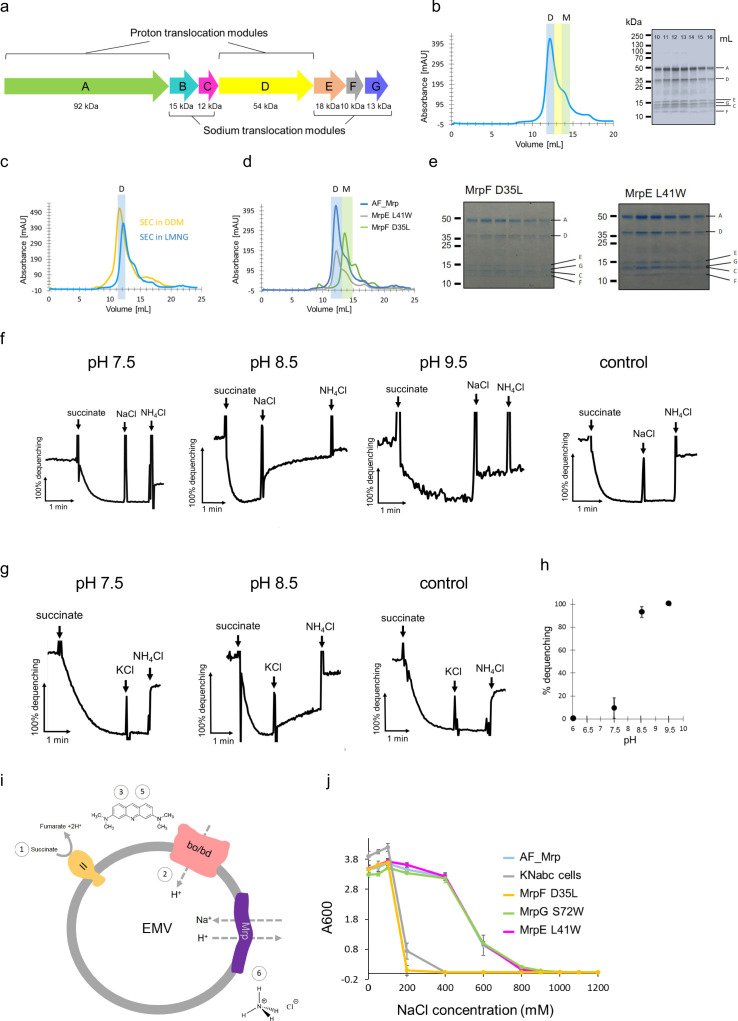
(a) Operon encoding seven subunits (MrpA-MrpG) of Anoxybacillus flavithermus WK1 mrp. Two modules based on the Mrp structure are indicated. (b) Mrp was purified by affinity- and size exclusion chromatography as a final step. The size exclusion elution profile is shown, with LMNG as detergent. The fraction in the middle of the dimer peak (which eluted at around 12.5 ml) was diluted for cryo-EM sample preparation. The elution peaks of the dimer and monomer are highlighted in blue and green, respectively. SDS-PAGE shows the presence of all Mrp subunits, identified by mass-spectrometry. (c) Size exclusion chromatography of Mrp in two different detergents - DDM and LMNG. The elution of the dimer is highlighted in blue. (d) Size exclusion chromatography of non-mutated (AF_Mrp) and mutated Mrp (MrpE L41W and MrpF D35L). The elution peaks of the dimer and monomer are highlighted in blue and green, respectively. (e) SDS-PAGE of the size exclusion chromatography fractions for the mutants MrpF D35L and MrpE L41W shows that all subunits co-elute in a single peak in each case. (f) Na+/H+ antiport activity of AF_Mrp in everted membrane vesicles (EMV) using NaCl to initiate Mrp activity at pH 7.5, pH 8.5 and pH 9.5. Non-transformed KNabc vesicles were used as a control at pH 8.5. The addition of succinate, NaCl and NH4Cl is indicated with arrows. The 100% percentage of acridine orange fluorescence dequenching is shown when 10 mM NH4Cl was added. (g) Na+/H+ antiport activity of AF_Mrp in EMV using KCl to initiate Mrp activity at pH 7.5 and pH 8.5. Non-transformed KNabc vesicles were used as a control at pH 8.5. (h) Na+/H+ antiport activity of AF_Mrp using NaCl to initiate Mrp activity is shown as the percentage of dequenching at pH 6.0, pH 7.5, pH 8.5 and pH 9.5. The results are averages from three independent preparations. The error bars show the standard deviations of the means. (i) Schematic of the Na+/H+ antiport activity using EMV. 1 – Addition of succinate to initiate respiration. 2- Oxidases create a ΔpH. 3 – Quenching of acridine orange. 4- Addition of NaCl to initiate Mrp activity. 5 – Dequenching of acridine orange, which is a measure of the Na+/H+ activity. 6 – Addition of NH4Cl to establish a baseline. (j) Experiments of complementation capacity of AF_Mrp and AF_Mrp mutants MrpF D35L, MrpG S72W, MrpE L41W for the growth of sodium sensitive E. coli KNabc cells. Non-transformed KNabc cells were used as a control. The results are averages from three independent experiments. The error bars show the standard deviations of the means.

