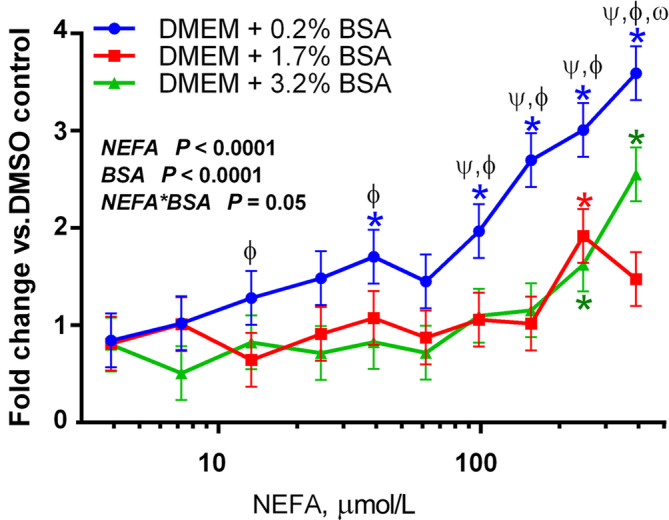
Fig. 1.

Activation of PPAR by NEFA isolated from a pooled postpartum serum sample of 5 Jersey cows. NEFA were diluted in culture medium either without additional albumin (0.2% BSA, supplied by the 10% FBS added to the culture media), or with albumin at sub-physiological (1.7%) or quasi-physiological (3.2%) concentrations. MAC-T cells were used for this experiment. Results are presented as fold change over vehicle control (0.5% DMSO). Asterisks indicate significant differences when compared to baseline (3.9 μmol/L NEFA), with each color corresponding to each BSA group. For each NEFA level, ψ denotes significant differences between 0.2 and 3.2% BSA; ϕ denotes significant differences between 0.2% and 1.7% BSA, and ω denotes significant differences between 1.7% and 3.2% BSA. The model-wise significance level of each parameter is presented in the figure. NEFA concentration on X-axis is presented on a logarithmic scale
