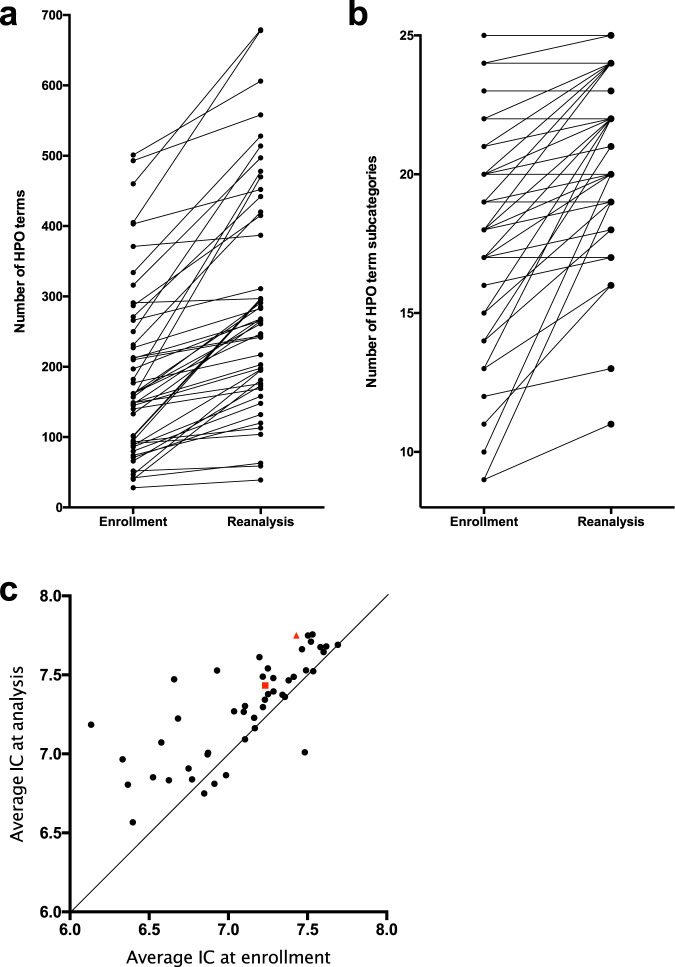
Fig. 2. Characterization of HPO term lists automatically extracted from patient EHRs.
a The number of HPO terms extracted at enrollment and reanalysis, with each case represented by two linked points. b The number of HPO subcategories (out of 28 total) represented by terms extracted at enrollment and reanalysis. c The average information content (IC) of HPO terms extracted at enrollment and reanalysis differed significantly (Wilcoxon paired signed-rank test; p < 0.0001). Each case is represented by one point. The two cases for which diagnoses were reported following reanalysis are represented by a red square (case 6009) and a red triangle (case 6033).

