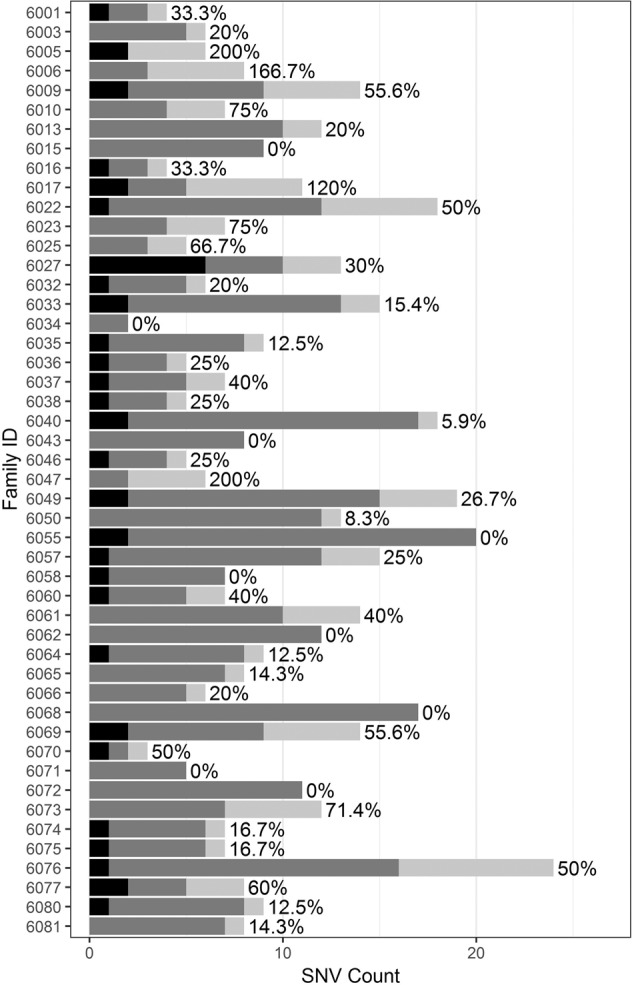
Fig. 4. Overlapping variant shortlists at enrollment and reanalysis.

Cases are ordered chronologically by date at enrollment. Black: variants on initial enrollment shortlist only; medium gray: variants on enrollment and reanalysis shortlists; light gray: variants on reanalysis shortlist only. The percentage next to each case’s bar reflects the number of new variants on the reanalysis shortlist, relative to the size of the initial enrollment shortlist (median = 25%).
