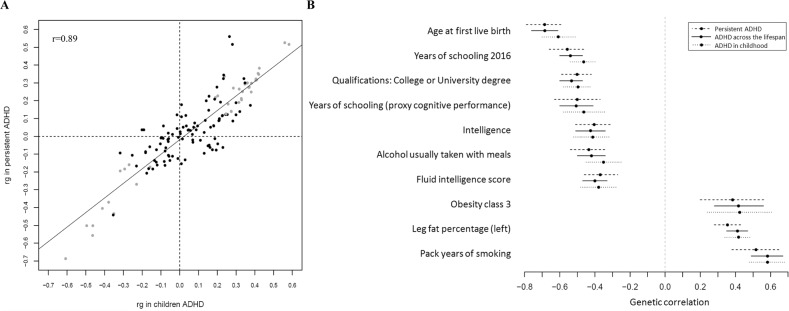
Fig. 4. Genetic correlation of ADHD and several traits.
a Dots represent genetic correlations (rg) for all traits considered (with h2 > 0.1 and z-score > 4) and those traits that met Bonferroni correction in both children and adult ADHD groups are presented in grey. r indicates Pearson’s correlation coefficient. b The ten strongest genetic correlations (with 95% confidence intervals) surpassing Bonferroni corrections in the children and persistent ADHD analysis are shown for each trait and ADHD.

