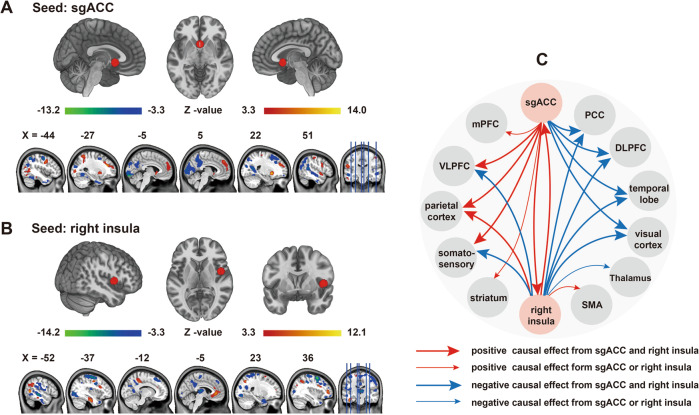
Fig. 3. Seed-based CaSCN results.
Regions with causal effects on the gray matter reduction in the sgACC (a) and the right insula (b) in patients with GAD (GRF correction; voxel level p < 0.001, cluster level p < 0.05). Summary of the results of Graphs A and B (c). The arrow lines in Graph C represent GC value. The bold arrow lines indicate positive or negative causal effects from the sgACC and the right insula. The thin arrow lines represent the positive or negative causal effects from the sgACC or the right insula alone. CaSCN causal structural covariance network, sgACC subgenual anterior cingulate cortex, GAD generalized anxiety disorder, GC Granger causality.

