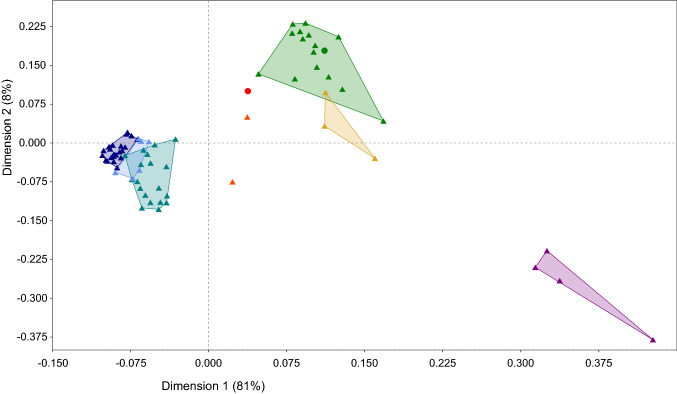
Fig. 5.
Principal coordinate analysis (PCoA) between the Solanum clones based on Mash distance. Symbol colours are based on clusters identified before by Hardigan et al. (2017; Fig. 1, data set 1). Wild species outgroup (purple triangles), wild species (green triangles), wild subgroup diverging from the cultivated lineage after most other species (gold triangles), landraces (teal triangles), tetraploid varieties (navy triangles); with the addition of hybrid between wild species and landraces (orange triangles) and diploid S. tuberosum (cornflower blue triangles). M6 is represented by a red dot and S. chacoense (PI 275139) by a green dot (color figure online)

