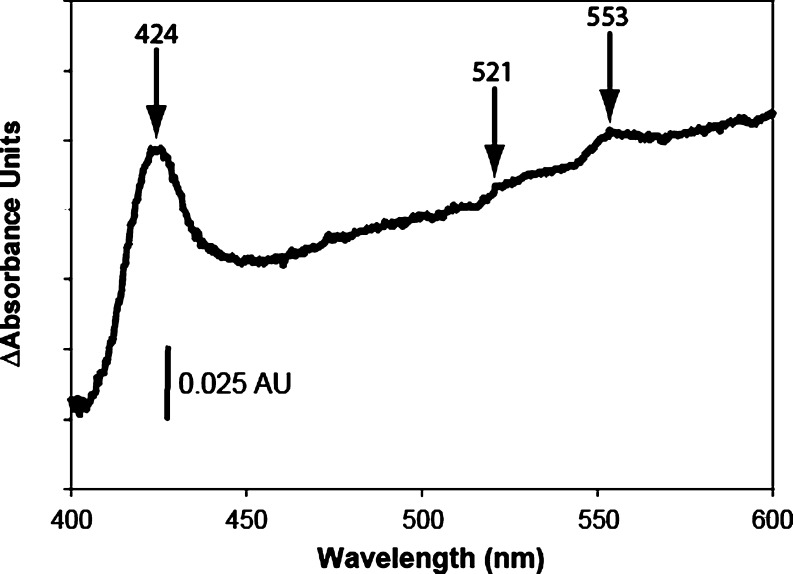
Fig. 4.
Whole cell difference spectrum of the Fe(II) reduced minus nitrate oxidized cytochrome content within intact live cells of strain 2002 suspended in anoxic (100% N2 atmosphere) PIPES buffer (20 mM, pH7.0). Arrows indicate absorption maxima with the corresponding wavelength denoted above the arrow. Vertical scale bar indicates a change of 0.025 absorbance units

