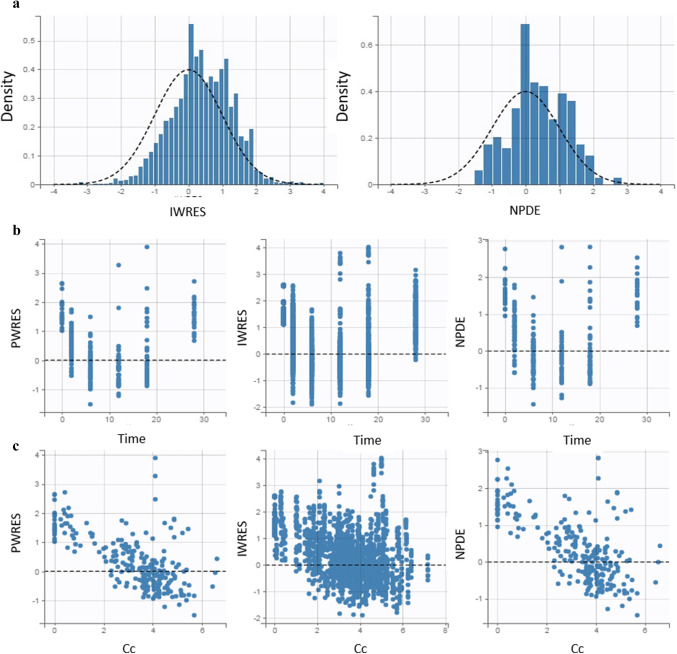
Fig. 2.
Distribution of residuals. a Representation of the normal distribution of residuals. The dashed line represents the theoretical distribution defined in the developed model and the bars the distribution of the observed data. b Homogeneous distribution of weighted residuals in relation to time. c Homogeneous distribution of weighted residuals in relation to predicted plasma concentration. IWRES weighted individual residual, NPDE normalized predicted errors, PWRES weighted population residual

