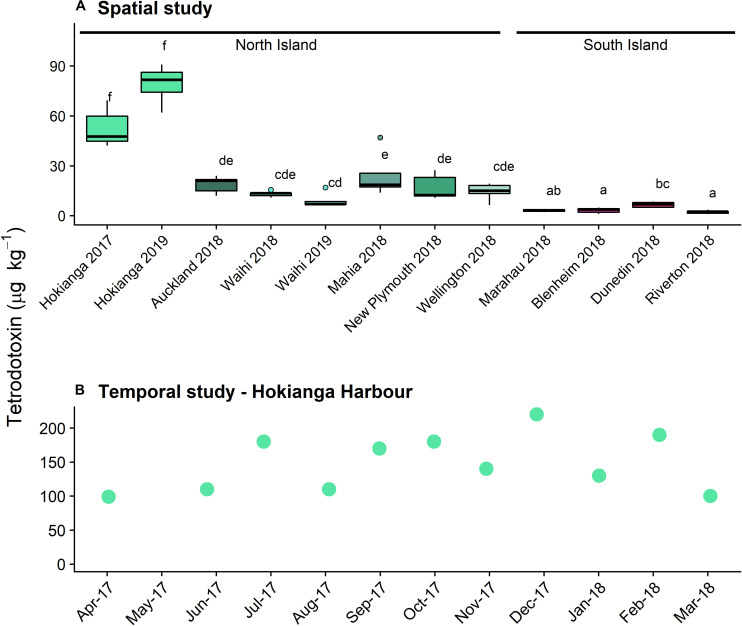
FIGURE 1.
Tetrodotoxin concentrations in populations of Paphies australis, (A) collected around the New Zealand coastline, determined using liquid chromatography-mass spectrometry (LC/MS; n = 5). Solid black line shows median, box shows 1st and 3rd quartiles, whiskers extend to the last data point within 1.5 times the inter-quartile range. Dots outside the whiskers are considered as outliers, defined as beyond 1.5× interquartile range. Different letters indicate where significant differences occur between sites (one-way ANOVA with Tukey’s HSD post-hoc test, p < 0.001). Sites are ordered by increasing latitude for each island. Data from 2018 and earlier was previously reported in Biessy et al. (2019b). (B) Tetrodotoxin concentrations in populations of P. australis collected from the Hokianga Harbor site over a one-year period, determined using LCMS (n = 1 pooled sample).

