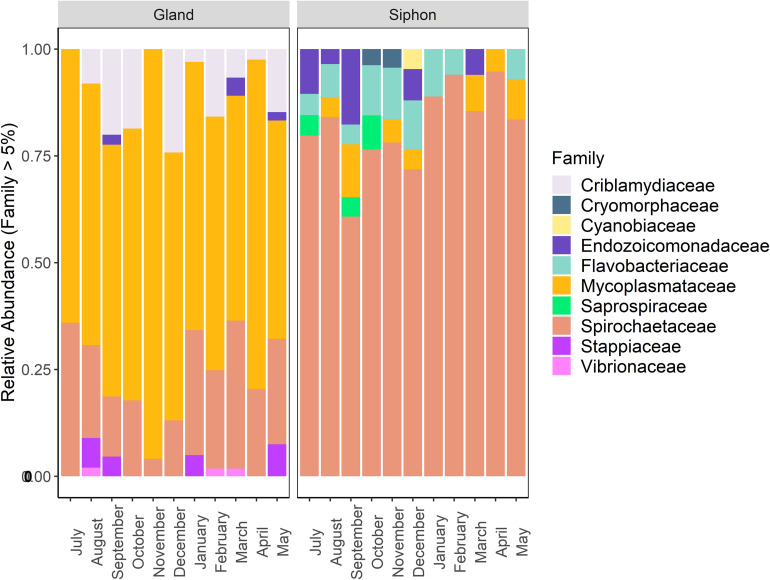
FIGURE 5.
Stacked bar plot showing the relative abundance of bacterial 16S ribosomal RNA sequences at the family level (contributing to >5% of total abundance) in Paphies australis digestive glands and siphons from the Hokianga Harbor (Northland, New Zealand), sampled every month from July 2017 to May 2018.

