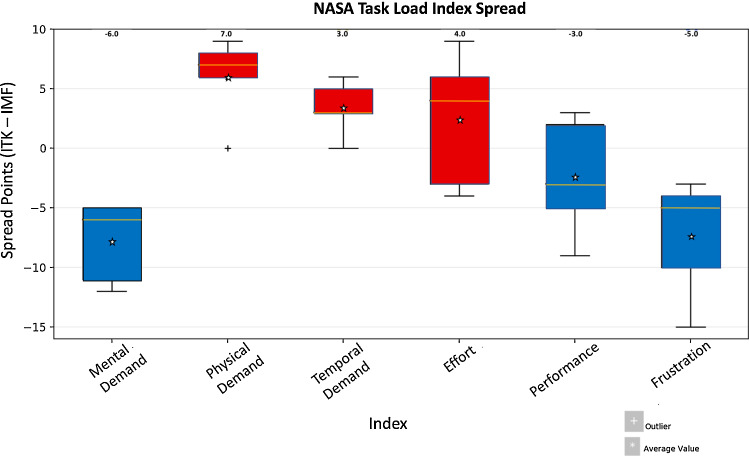
Fig. 4.
Relative NASA TLX spread data. The ImFusion score was subtracted from the ITK-SNAP score for each participant and combined for each index to show spread of data across participants. Positive values represent a greater score for ITK-SNAP, while negative values were greater for ImFusion. The scores at the top indicate the median value, while the colours represent the software which the mean value favoured. Blue indicates a mean which favoured ImFusion labels, while red indicates a mean value which favoured ITK-SNAP

