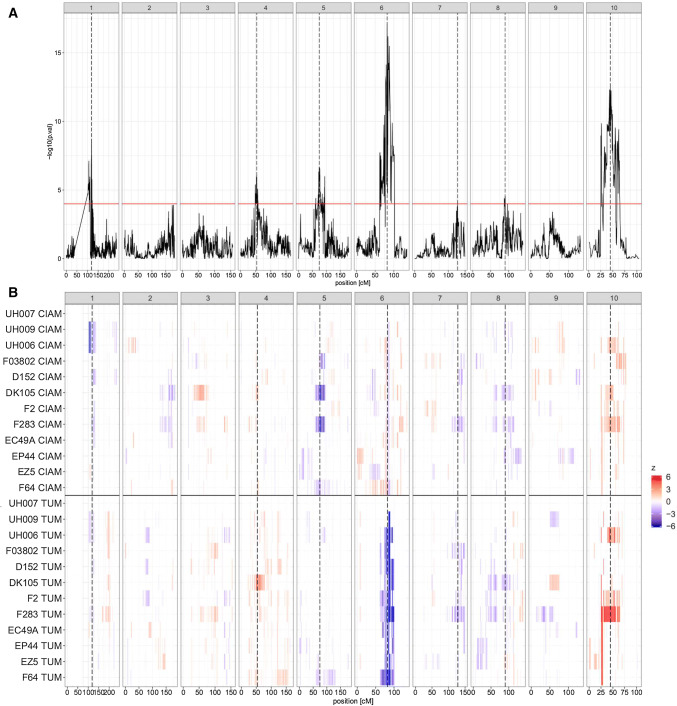
Fig. 1.
a CIM − log10(p values) profile of the EU-NAM M4 parental QTL analysis. b Within environment parental QTL allelic significance along the genome. Wald test p values of the parental allelic substitution effects after transformation into a colour code (z). If p-val [; 0.05]: . If p-val : to prevent the colour scale from being determined by high significant values. The colours red (positive) and blue (negative) correspond to the sign of the QTL effect (colour figure online)

