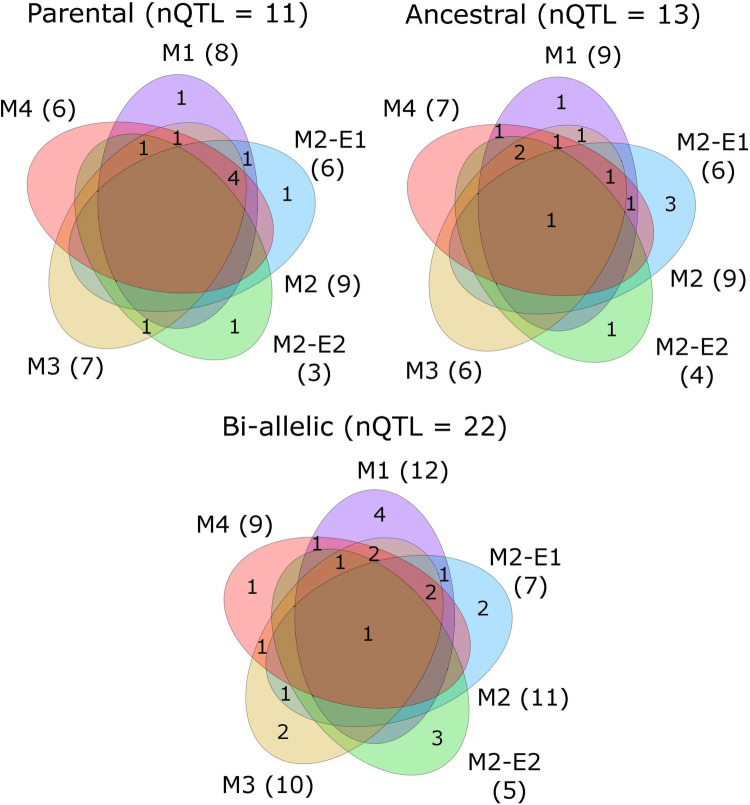
Fig. 2.
Number of unique QTLs for each type of QTL effects (parental, ancestral and bi-allelic) detected specifically in M1, M2 environment 1 (M2-E1), M2 environment 2 (M2-E2), M2 (two environments combined), M3 and M4 or common to different methods for DMY in the EU-NAM Flint population. The numbers of unique QTLs detected per method are in parentheses. QTLs detected by two methods were the same if they were separated by less than 10 cM (colour figure online)

