
Fig. 4.
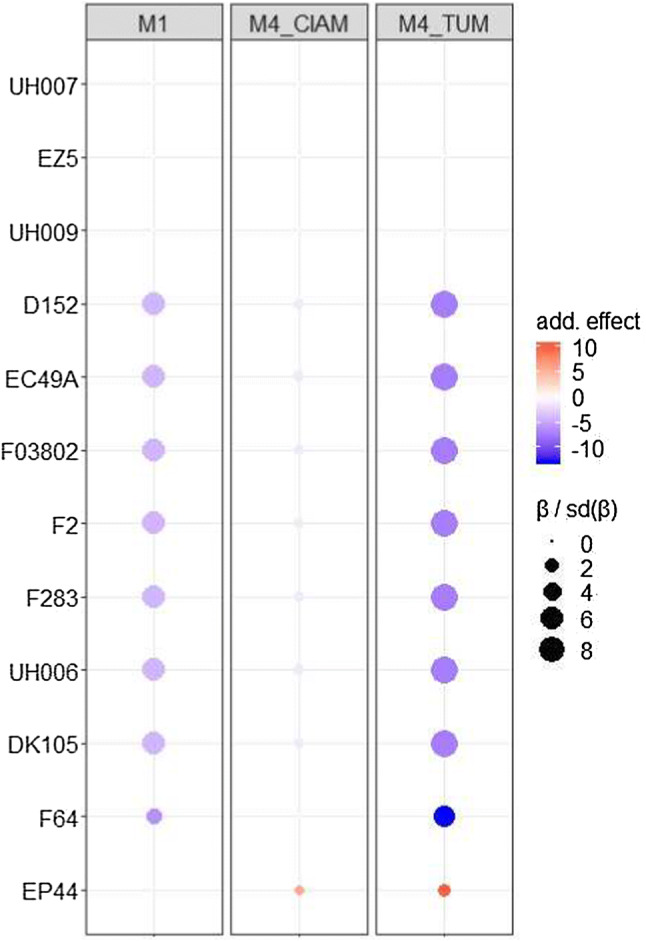
Comparison of the allelic substitution effect series between M1 and M4 for the position detected on chromosome 6 at 82.1 cM in the EU-NAM Flint with the ancestral model. The colour intensities are proportional to the allelic effect. The allelic effects are deviations in decitons per hectare with respect to the central parent (UH007). The sizes of the dots are proportional to the ratio between the allelic effect and its standard error (colour figure online)