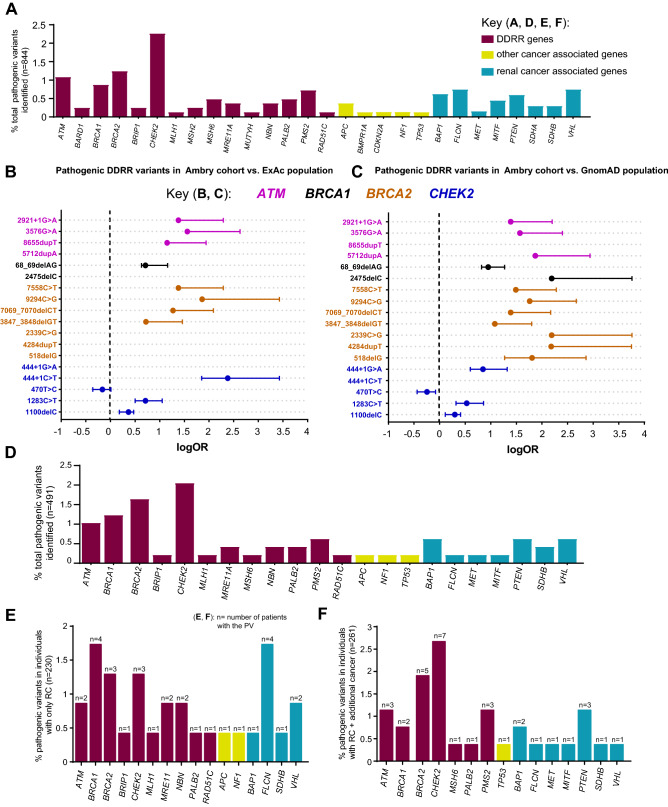
Figure 2.
Enrichment of PVs in DDRR genes. (A) Cases with germline PVs in the entire cohort (n = 844). (A) Red bars; DDRR genes, yellow bars; other-cancer associated genes; blue bars; RC genes. APC variants identified in this study were all the moderate risk c.3920T>A, p.I1307K variant, and 5 of the 19 CHEK2 variants were the moderate risk c.470T>C, p.I157T variant. *The individual with MUTYH was a compound heterozygote with two PVs. The data is presented as percent rather than ‘n’ due to the fact that not all 49 genes were tested for all patients in the full study cohort of 844 individuals. The percent adjusts for the number of individuals that were tested for each gene. The ‘n’ values are listed in Supplemental Table 3. (B,C) Odds of finding PVs in ATM (pink circle), BRCA1 (black circle), BRCA2 (orange circle), and CHEK2 (blue circle) from study cohort versus control population, ExAc (B) and gnomAD (C). Data is presented as log10 odds ratio (OR), and log10 confidence intervals. Dotted black line; association with outcome i.e. OR > 0 is enrichment in study cohort, OR = 0 no difference in cohorts. PVs not found in gnomAD or ExAc are indicated by the absence of any data or PVs not listed from Supplemental Table 4 were not found in the control population. Note: Computation of proportion or burden of individuals with all PVs in a specific gene(s) in the control population cannot be accurately performed as all PVs have not been defined, and while there is some agreement on which variants in a specific gene(s) are currently considered PVs, this is not true for all variants in that gene (as referenced in ClinVar, https://www.ncbi.nlm.nih.gov/clinvar/). (D) Cases with germline PVs in the cohort tested for all genes in the study (n = 491, 49 genes). The total ‘n’ is listed in Supplemental Table 6. (E) Individuals with germline PVs who were diagnosed with only RC (n = 230/491). The total ‘n’ is shown above the bar as PV per gene. (F) Individuals with germline PVs who were diagnosed with RC plus at least one additional primary cancer type (n = 61/491). The total ‘n’ shown above the bar as PV per gene. The color scheme as in (A). In (D–F), to remain consistent between graphs, the data is presented as percent rather than ‘n’ even though all 49 genes were tested for all individuals represented in these graphs.

