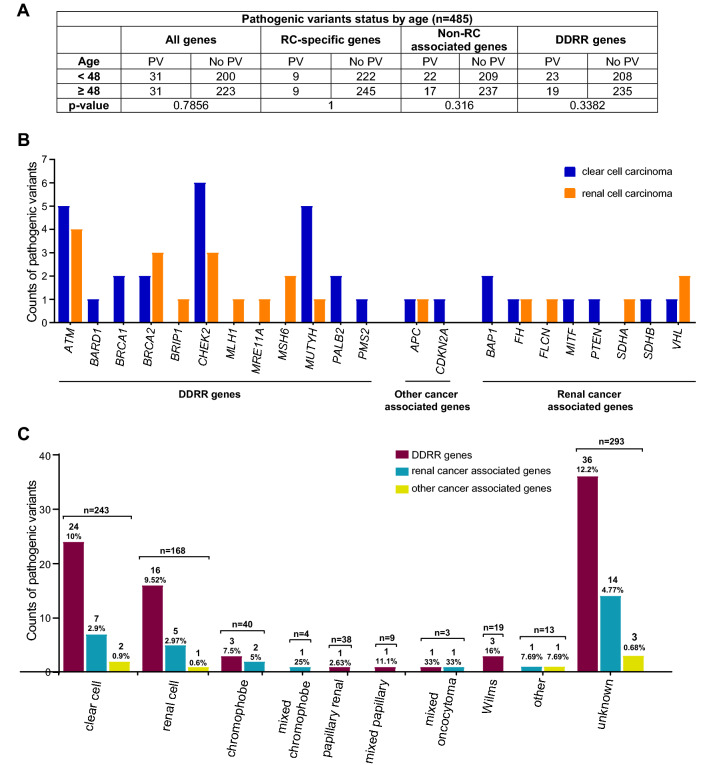
Figure 3.
Identified PVs compared to age of RC diagnosis, and histology of RC. (A) Statistical comparison of PVs in all genes, RC-specific genes, non-RC and DDRR genes in younger individuals (< 48) versus older individuals (≥ 48). N = 485, these cases were tested for all 49 genes; all cases with Wilms tumor were removed. The results were non-significant (p > 0.05) using two-sided Fisher’s exact tests. (B) Counts of PVs by RC histology: clear cell (blue bar) and renal cell (orange bar) carcinoma in the study cohort. The' renal cell' subtype, is likely clear cell, but this cannot be confirmed. (C) Counts of PVs by all RC histology observed in the study cohort. DDRR genes (maroon bars), other-cancer associated genes (yellow bars), RC-specific genes (blue bars). The total number of individuals with a PV and percent PVs per gene category is shown above the bar. (B,C) Includes counts from both homozygous and heterozygous carriers of MUTYH, and carriers of a FH variant that is currently considered to be pathogenic only in the compound heterozygous or homozygous state.

