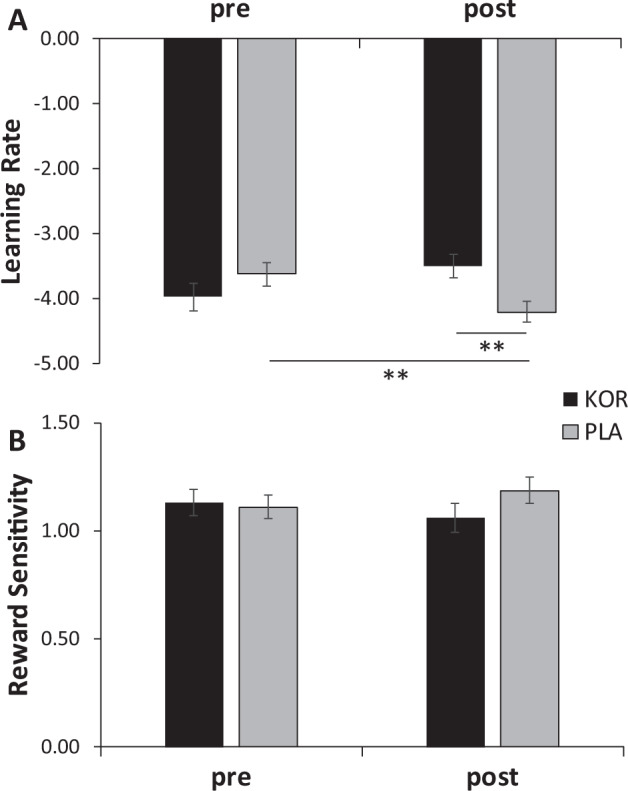
Fig. 2. Pre- to Post-treatment changes in Computational Modeling Parameters as a Function of Treatment.

a Learning rate and b reward sensitivity in the KOR (n = 24) and Placebo (N = 31) group pre- and posttreatment. Error bars denote standard errors. Estimated means are plotted (covariate: pretreatment SHAPS scores). Note that the learning rate and reward sensitivity parameters were transformed to prevent issues with nonnormal distribution. ***p < 0.01, **p < 0.05, *p < 0.10.
