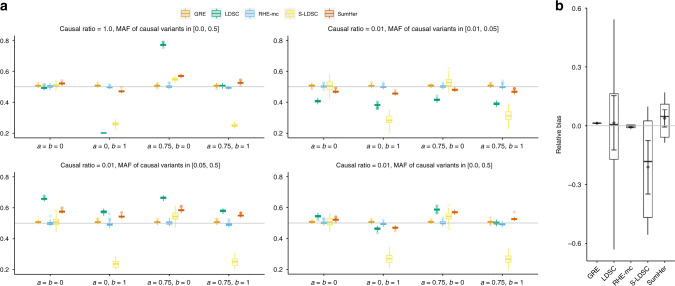
Fig. 1. Comparison of estimates of genome-wide SNP heritability from RHE-mc with LDSC, GRE, S-LDSC, and SumHer in large-scale simulations (N = 337,205 unrelated individuals, M = 593,300 array SNPs).
a We compared methods for heritability estimation under 16 different genetic architectures. We set true heritability to 0.5 and varied the MAF range of causal variants (MAF of CV), the coupling of MAF with effect size (a = 0 indicates no coupling with MAF and a = 0.75 indicates coupling with MAF), and the effect of local LD on effect size (b = 0 indicates no dependence on LDAK weights and b = 1 indicates dependence on LDAK weights) (see “Methods” section). Each boxplot represents estimates from 100 simulations. b Relative bias of each method (as a percentage of the true h2) across 16 distinct MAF-dependent and LD-dependent architectures. Each boxplot contains 16 points; each point is the relative bias estimated from 100 simulations under a single genetic architecture. Points and error bars represent the mean and ±2 SE. In a and b, boxplot whiskers extend to the minimum and maximum estimates located within 1.5× interquartile range (IQR) from the first and third quartiles, respectively. Here, we run RHE-mc using 24 bins formed by the combination of six bins based on MAF as well as four bins based on quartiles of the LDAK score of a SNP (see “Methods“ section). We run S-LDSC with only 10 MAF bins (see Supplementary Table 5). To do a fair comparison, for every method, we computed LD scores and LDAK weights by using in-sample LD, and in all simulations we aim to estimate the SNP-heritability explained by the same set of M SNPs.

