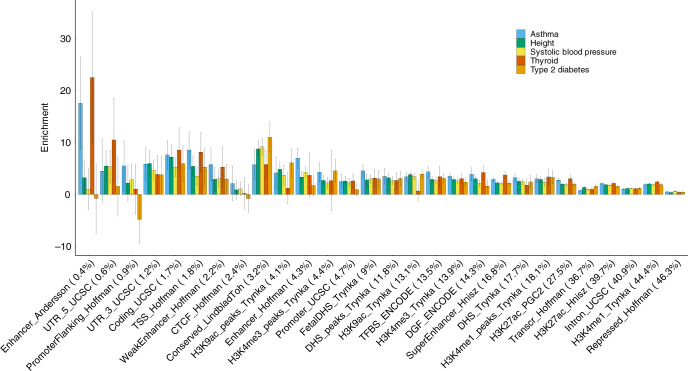
Fig. 6. Enrichment of heritability across 28 functional annotations.
We applied RHE-mc to N = 291,273 unrelated white British individuals and M = 5,670,959 imputed SNPs (MAF > 0.1% and present in 1000 Genomes Project). SNPs were partitioned based on 28 functional annotations that were defined in a previous study7. We grouped 22 traits in the UK Biobank into five categories (autoimmune, diabetes, respiratory, anthropometric, cardiovascular). Here we plot enrichment of five traits (one representative trait per category). Each bar represents the estimated enrichment. Black error bars mark ±2 standard errors centered on the estimated enrichment. Annotations are ordered by the proportions of SNPs in that annotation (given in parentheses). See Supplementary Fig. 8 for results on all 22 traits.

