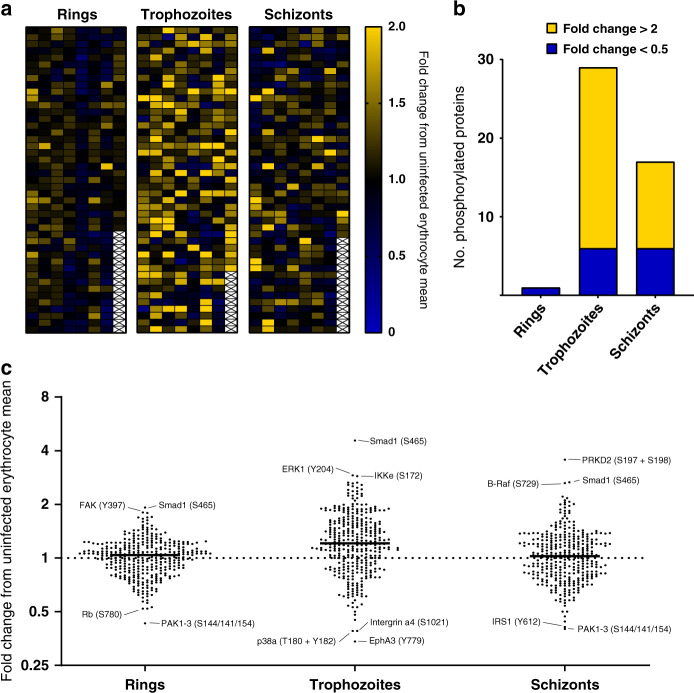
Fig. 2. Microarray data for the ring, trophozoite and schizont stages.
a Heatmap of phosphospecific antibody array data for ring-, trophozoite- and schizont-infected cells after the removal of cross-reactive and weak signals. b Phosphorylation-specific signals (post-filtering) ranked according to fold change. Yellow represents changes with a fold change > 2; blue represents changes with a fold change < 0.5. Full datasets are presented in Supplementary Data 1 and 2. c Dot plot highlighting differences in phosphosite signals represented as fold change. The largest changes are listed with their associated phosphorylation site. Source data are provided as a Source Data file.

