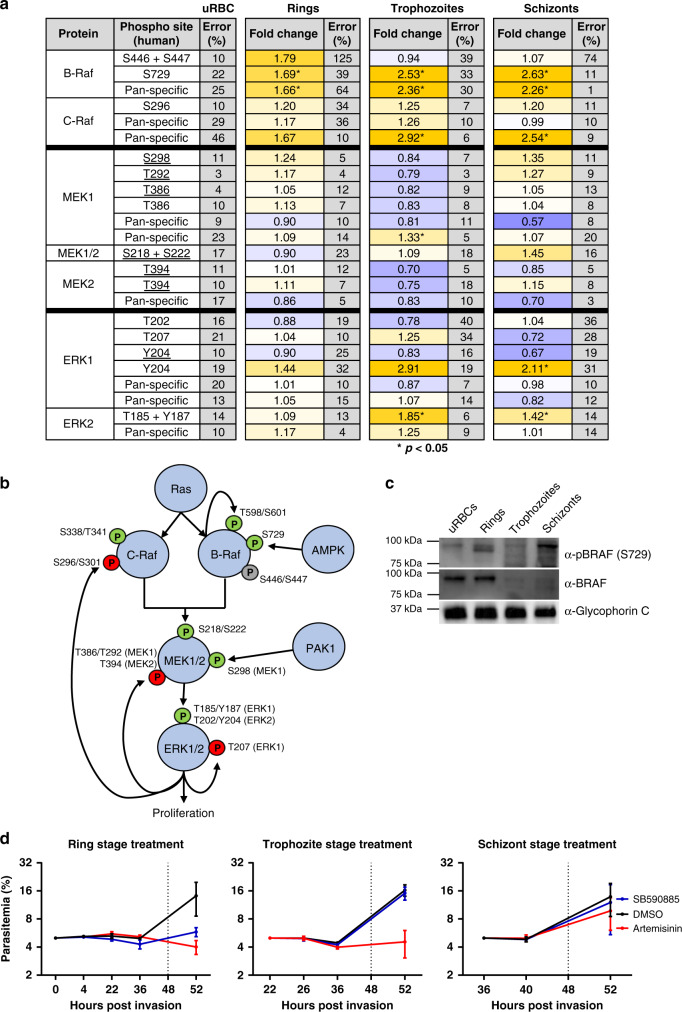
Fig. 4. Activation of a MAPK pathway in infected erythrocytes.
a Summary table of the MAPK pathway components and phosphorylation sites covered by the antibody microarray, including RAF, MEK1/2 and ERK1/2 with the fold change from the uninfected erythrocyte control signal for each of the three time points (erythrocytes infected with rings, trophozoites or schizonts) shown. Signals that were significantly different during infection are marked by an asterisk (p < 0.05, two-tailed T-test). Phosphosites underlined in the table were flagged as cross-reactive with parasite material in Fig. 2, but are included here for completeness. b Schematic representation of the MAPK pathway with the relevant phosphorylation sites present in the array data set covered in a. Green ‘P’ represents phosphorylation sites associated with the activity of the respective kinase, whereas the red ‘P’s represent negative feedback phosphorylation sites. The grey ‘P’ represents a known priming site on B-Raf. c Western blotting validation of B-Raf phosphorylation. A phospho-specific antibody to B-Raf (S729) detected phosphorylated B-Raf in ring-stage infected erythrocytes (upper panel). A pan-B-Raf antibody detected B-Raf in the uninfected and ring-stage-infected erythrocyte samples, with a strong decrease at the trophozoite and schizont stages (middle panel). An antibody against Glycophorin-C was used as a loading control (lower panel), n = 3 independent experiments. d Synchronized P. falciparum cultures were treated in 4 h windows with 2.45 µM SB-590885 (5× IC50, see Fig. 6), 0.091 µM artemisinin or DMSO (vehicle control), starting at 0 (rings), 22 (trophozoites) and 38 (schizonts) h post invasion (the black arrows indicate the end of treatment, where the medium was replaced with fresh medium without drug). The parasitemia was then monitored until the next cycle of parasite development to assess parasite survival. Starting parasitemia was normalized to 5% across the biological replicates (n = 3) error bars represent the SEM. Source data are provided as a Source Data file.

