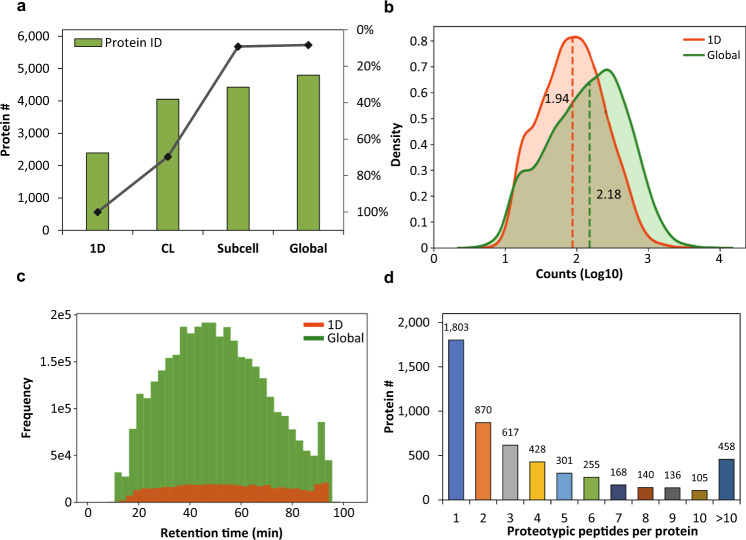
Fig. 2.
Characteristics of the SWATH CHO global spectral library. (a) The stacked bar chart showed the numbers of confidently quantified protein ID (at 20% CV cutoff and 1% peptide FDR) when using 1D library (1D, 3 fractions), cell-lysate library (CL, 33 fractions), subcellular-organelle library (Subcell, 33 fractions), and CHO global spectral library (Global, 63 fractions). The percentage of increase was calculated by dividing the number of increased protein ID by the total number of protein ID. (b) The distributions of the assays per protein in the CHO global spectral library and 1D library. The dash lines indicated the median values of the assays per protein. (c) The histogram distributions of the coverage and the number of peptides eluting across the LC separation gradient for the CHO global spectral library and 1D library. (d) The bar chart showed the confidently quantified proteotypic peptides per protein (at 20% CV cutoff and 1% peptide FDR) in the CHO-K1 WCL SWATH-MS data set using the CHO global spectral library.

