Fig. 4.
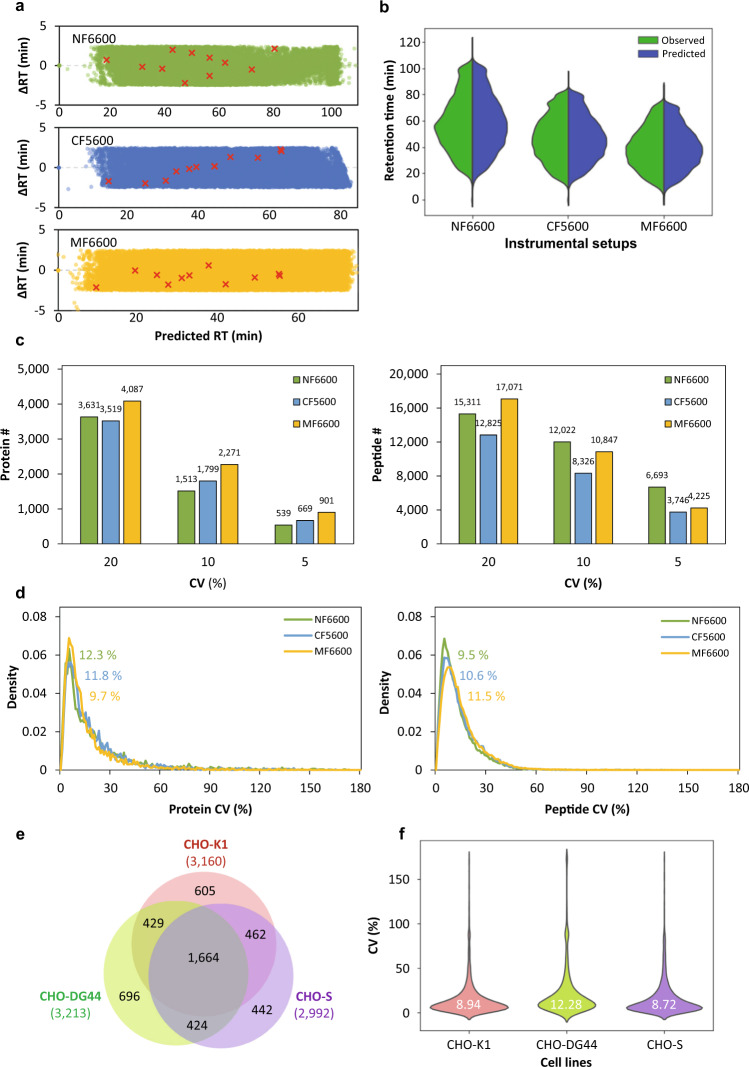
The robustness of the SWATH CHO global spectral library in quantification of CHO proteome. (a) The correlation between the ∆RT and the predicted retention times in three LC-MS instrumental setups. The red colored “×” represented the 11 iRT reference peptides. (b) The violin plot showed the distribution of observed and predicted retention times in three instrumental setups. (c) The bar charts showed the numbers of confidently quantified proteins (left) and peptides (right) after 20%, 10% and 5% CV cutoff. (d) The CV distribution of all the identified proteins (left) and peptides (right) in three LC-MS instrumental setups. The median CV values in each condition were highlighted. (e) Venn diagram analysis of confidently quantified protein ID (at 20% CV cutoff and 1% peptide FDR) between three CHO cell lines. The total protein IDs of respective cell lines were indicated in brackets. (f) The violin plot showed the distribution of the protein CV values across three CHO cell lines with the median CV values highlighted in white color. NF6600: nanoflow LC coupled to TripleTOF 6600; CF5600: capillary flow LC coupled to TripleTOF 5600 + ; MF6600: microflow LC coupled to TripleTOF 6600.

