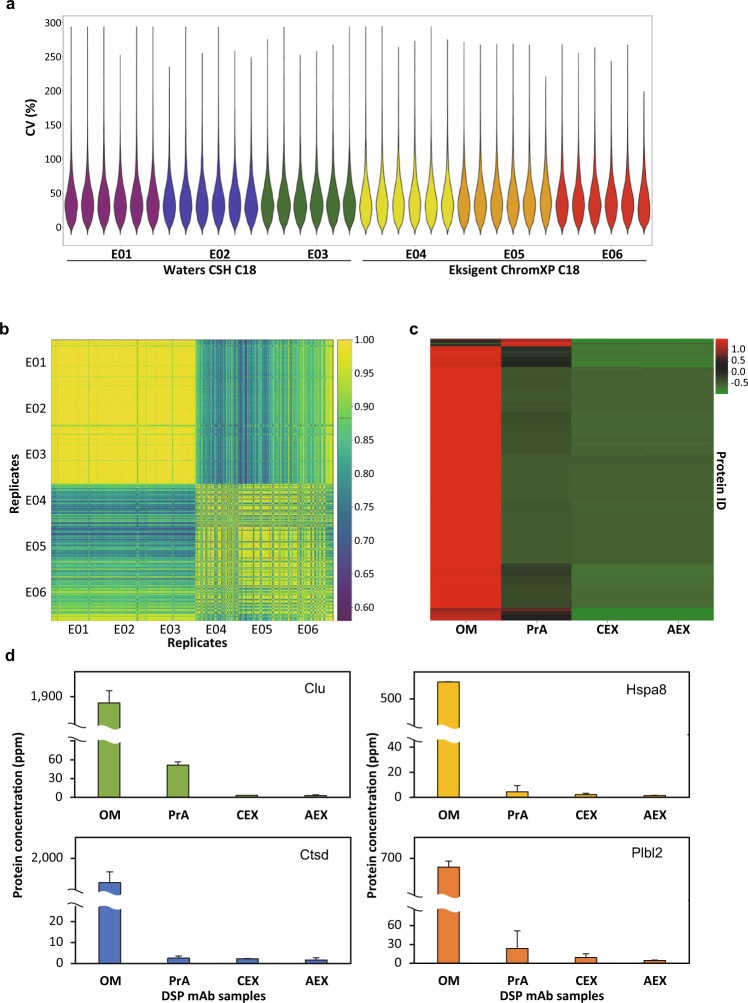
Fig. 5.
The application of CHO global spectral library in proteome profiling and quantification of HCCF and DSP mAb samples. (a) The violin plot showed the distribution of CV values across the large-scale analysis of HCCF samples. The CV values were calculated using the technical replicates for each of the six biological replicates in E01 – E06. (b) The Pearson correlation matrix of the abundance of proteins identified in the HCCF samples from experimental group E01 – E06. The median correlation coefficient r value (0.88) was represented as a red colored dash line in the color bar. (c) Heat map analysis of confidently identified proteins (at 20% CV cutoff and 1% peptide FDR in OM) in the typical DSP purification workflow. (d) The bar chart showed the average protein abundances of four well-known difficult-to-remove HCPs, including clusterin (Clu), cathepsin D (Ctsd), heat shock cognate 71 kDa protein (Hspa8) and phospholipase B-like 2 (Plbl2), identified in the DSP purification process. The error bars indicated the standard deviations between replicates. OM: original material; PrA: protein A eluate; CEX: cation exchange; AEX: anion exchange.

