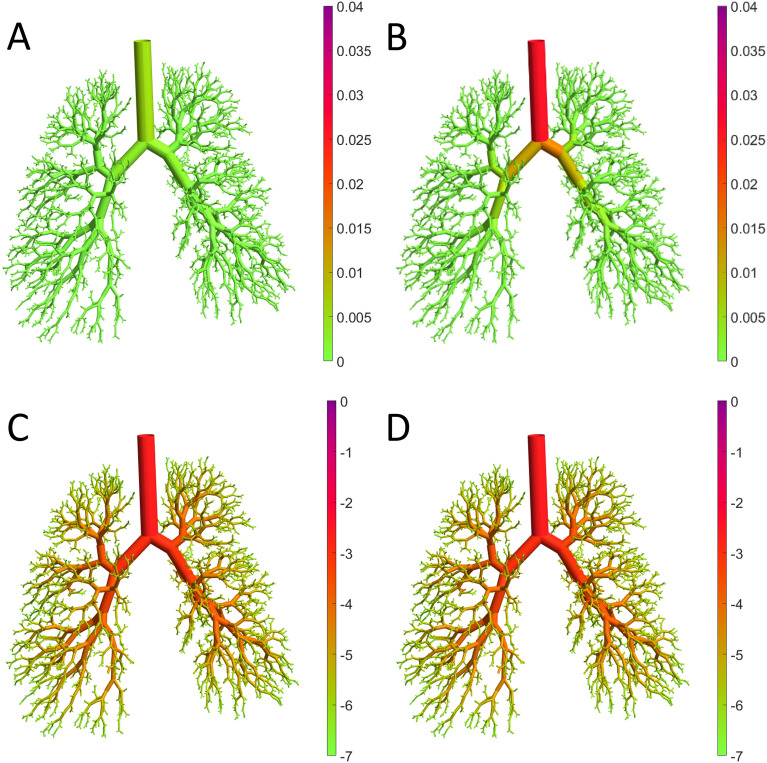
Figure 6.
Steady state solutions of the probability of capture for optimal flow policy (A) and maximum flow policy (B) using the 3.5 μm particle. Probability of capture for the 0.35 μm for the optimal flow policy and for a maximum flow are shown in (C) and (D), respectively. Color intensity is proportional to the probability for a given segment for panels (A) and (B) and, because of the wide range of values, the logarithm of probability for panels (C) and (D).

